Trend Indicator🏔️
Moving Averages: All You Gotta Know 🧮📊
Moving averages are a mathematical tool used to analyze the prices of financial assets such as stocks, cryptocurrencies, or currencies. 📊 Their main purpose is to smooth out price fluctuations to identify clearer trends. They are very popular in technical analysis because they help remove the “noise” from daily market movements and allow you to focus on overall price behavior.
Table of Contents
1. How Do Moving Averages Work?
2. What Are Moving Averages Used For?
3. Types of Moving Averages
4. Advantages of Moving Averages
5. Limitations of Moving Averages
6. Strategies for Using Moving Averages
7. Practical example of the Moving Average
8. Tips for Using Moving Averages
9. Final Thoughts on Moving Averages
How Do Moving Averages Work?⚙️
They are calculated by averaging the prices of an asset over a specific period of time. For example, if you want a 10-day moving average, you add up the closing prices of those 10 days and divide by 10. This process is repeated as the days progress, creating a continuous line on the chart.
As we always do at WAFFT, we explain it to you in a very simple way:
▫️Imagine that you sell lemonade for 10 days 🍋
Day 1: You sold 10 glasses.- Day 2: 12 glasses.
- Day 3: 8 glasses.
- Day 4: 15 glasses.
- Day 5: 9 glasses.
- Day 6: 11 glasses.
- Day 7: 14 glasses.
- Day 8: 10 glasses.
- Day 9: 13 glasses.
- Day 10: 7 glasses.
▫️To calculate the average (your 10-day moving average):
Add up all the glasses sold: 10 + 12 + 8 + 15 + 9 + 11 + 14 + 10 + 13 + 7 = 109- Divide by 10 (the days): 109 ÷ 10 = 10.9
So your 10-day moving average is 10.9 glasses per day. If you do this every day, you'll see how your average changes over time, and that creates a solid line on your graph! 📈
What Are Moving Averages Used For?🎯
Moving averages are like the GPS of the trading world: they help you navigate the markets and make decisions with more confidence.
🌟 Here are their main uses:
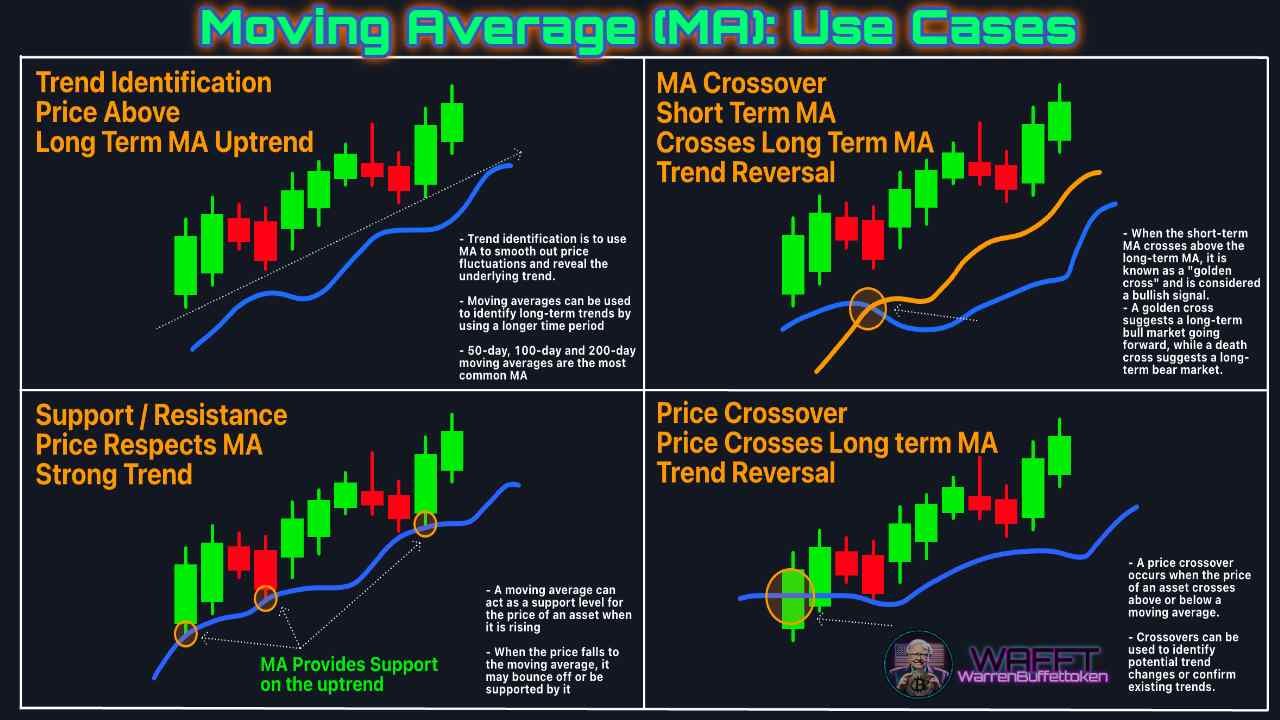
🔍Identifying trends
Moving averages are perfect for detecting whether a market is bullish (rising) 📈, bearish (falling) 📉 or simply aimless (sideways).
If the moving average is tilted upwards, it is a sign of a positive trend.
- If it points downwards, we are in bearish territory.
🚦Generating buy and sell signals
One of the most popular uses of moving averages is as an action indicator:
When a short-term moving average crosses upwards over a long-term one, it is time to buy. 🛒
- If the crossover is downwards, it is a sign that you might consider selling or reducing your position. 💼
🛡️Dynamic support and resistance
Moving averages are also used as dynamic support and resistance levels. 📏
In an uptrend, the price often bounces off the moving average (acting as support).
- In a downtrend, it can function as resistance, marking areas where the price could stop or retrace.
🔄Filtering market noise
If you are overwhelmed by day-to-day volatility, moving averages are your ally. 🤝 They smooth out small fluctuations and allow you to focus on the bigger picture, avoiding impulsive decisions.
🤝Complementing other tools
Do you use indicators such as the RSI or MACD? Moving averages can reinforce your analysis and give you a more complete view. 🔗 They work great as part of a combined strategy.
In short, moving averages are the "must-have" for any trader. ✨ From helping you identify trends to generating clear signals, they are a versatile tool that can't be missing from your arsenal. 💼
Types of Moving Averages
Moving averages can be calculated in different ways, depending on how you want to analyze prices. Here, we explain the most important types in true WAFFT style:
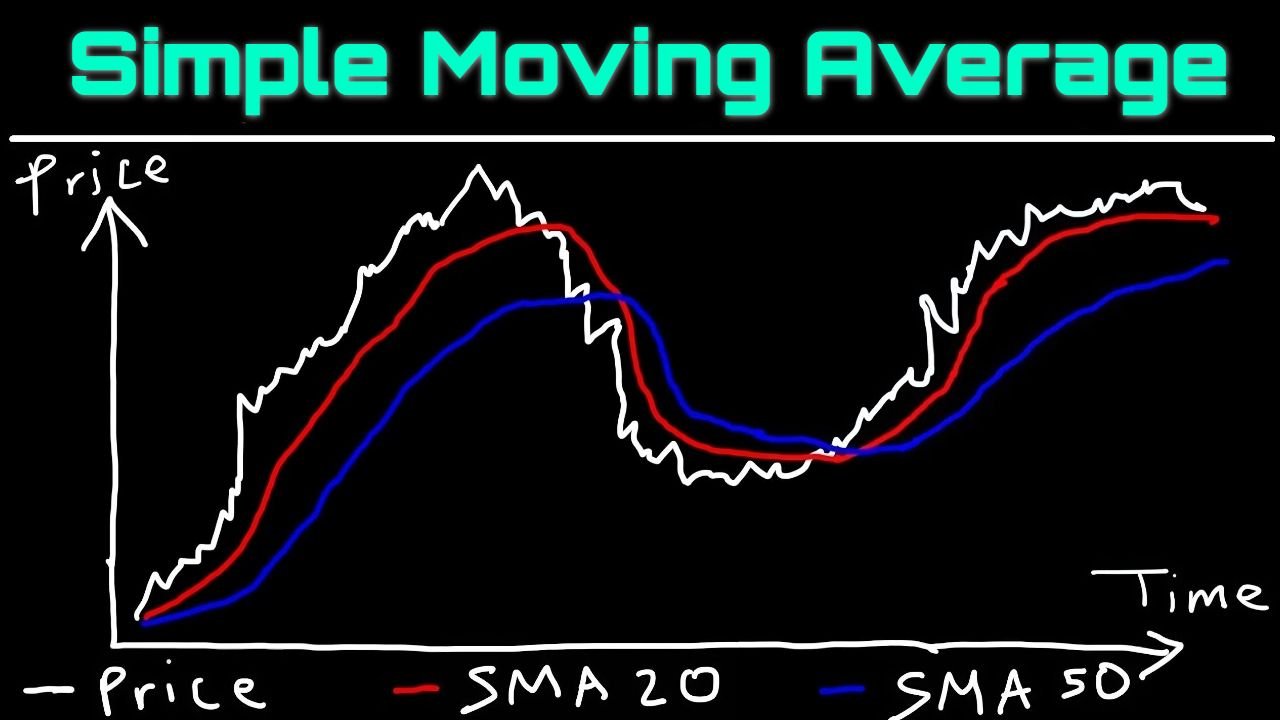
1. Simple Moving Average (SMA)🟢
🔹What is it?
This is the most basic type of moving average. It averages prices over a specific period of time. It's like averaging your cryptocurrency purchases.
🔹How is it calculated?
You add up all the closing prices (or values) for the days you choose.
- You divide the sum by the number of days.
💡Example:
Imagine you want to calculate a 5-day SMA:
- The prices are: 10, 12, 14, 16, 18.
- You add: 10 + 12 + 14 + 16 + 18 = 70.
- You divide by 5 (the days): 70 ÷ 5 = 14.
Your SMA is 14. Each day it is recalculated by adding the most recent price and removing the oldest, which makes the line move on the chart.
🔹What is it for?
It helps you see the overall trend.
- It is ideal if you want basic, long-term analysis.
2. Exponential Moving Average (EMA)🔵
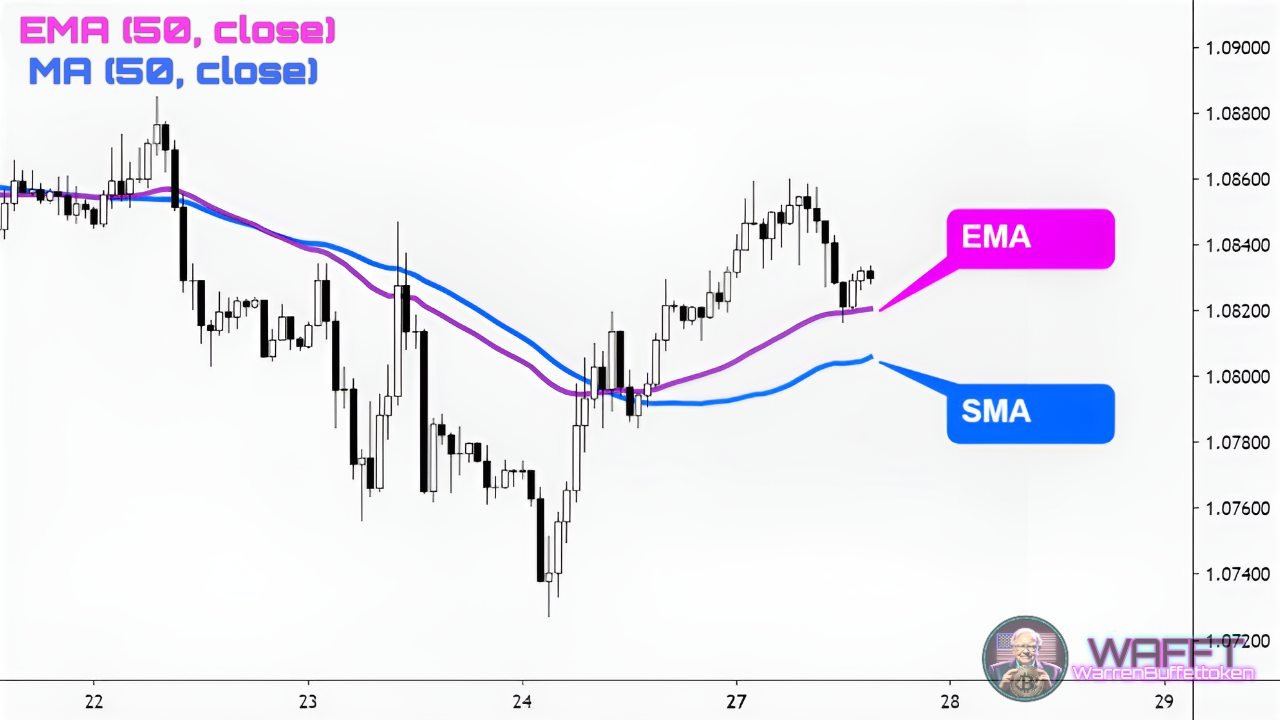
🔹What is it?
It's a more advanced version of the SMA. Instead of treating all prices the same, it gives more importance to the most recent prices. It's like the newer prices speak louder to tell you what's happening now. This makes the EMA able to react faster to market changes, as if it were always ready to detect what's coming next.
🔹How is it calculated?
A special formula is used that multiplies recent prices by a "weight factor".
Although it sounds complicated, the charts automatically calculate it for you.
💡Example:
Imagine that in the last few days the price changed a lot. The EMA will react quickly because it pays more attention to what just happened.
🔹What is it for?
It is useful in markets where prices change quickly, such as cryptocurrencies. 🪙
- It helps you detect trend changes before the SMA.
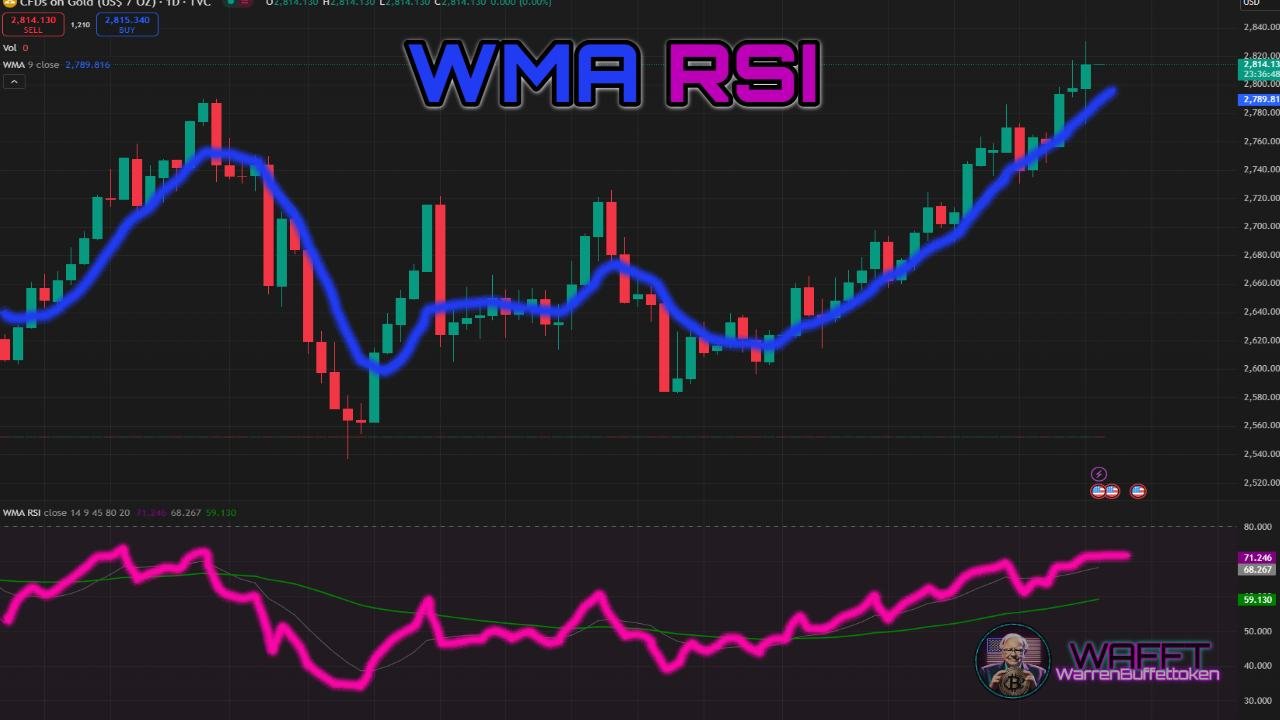
3. Weighted Moving Average (WMA)⚖️
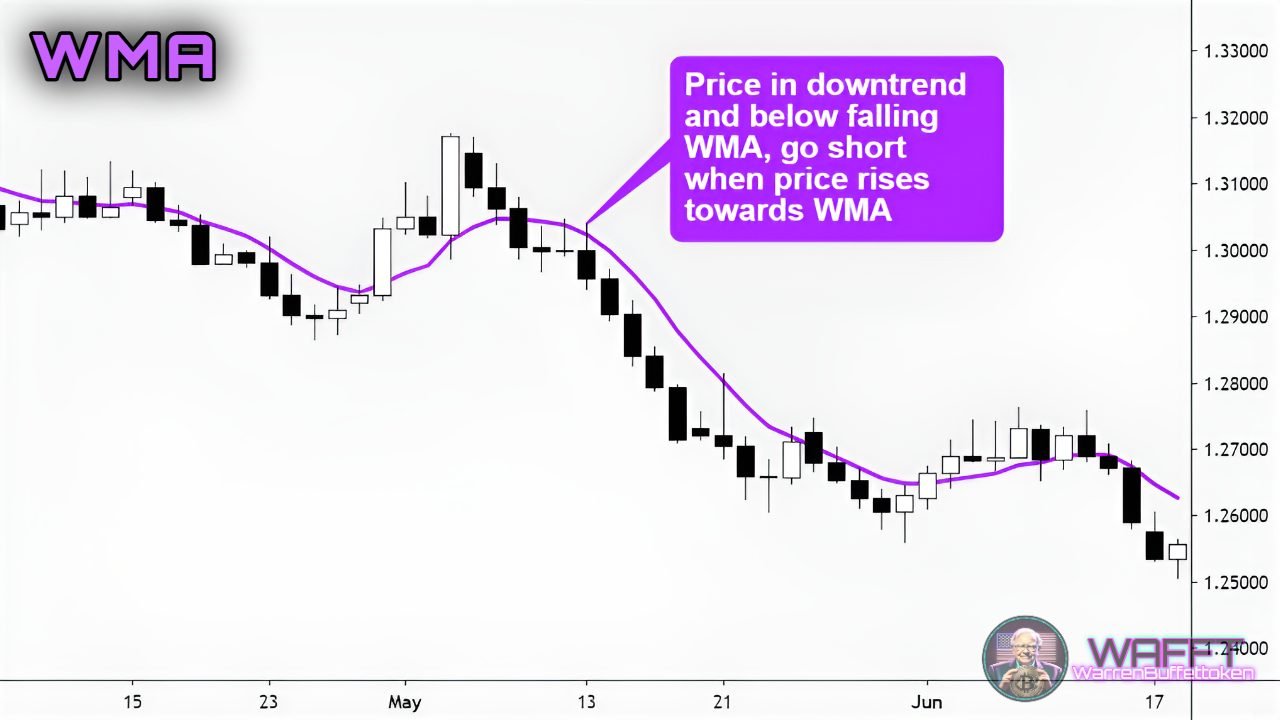
🔹What is it?
It is like the EMA, because it also gives more importance to recent prices, but it does so in a fair way. Each price has a different "weight" depending on how old it is: newer prices count more, and older ones count less. It is as if in a race the fastest runners (new prices) push the average harder, but the slower ones (old prices) also help a little bit. This makes the average more accurate and a better reflection of what's happening now.
🔹How is it calculated?
A weight is assigned to each day: the most recent price has the highest weight, and the previous days have lower weights.
Then, each price is multiplied by its weight, the results are added together, and divided by the sum of the weights.
💡Example:
If the prices for the last 3 days are 10, 20, and 30, their weights can be:
- Day 1 (oldest): 1.
- Day 2: 2.
- Day 3 (newest): 3.
🔹Calculation:
- (10 × 1 + 20 × 2 + 30 × 3) ÷ (1 + 2 + 3) = (10 + 40 + 90) ÷ 6 = 23.3.
🔹What is it for?
It gives you a slightly more accurate perspective than the SMA.
- It is ideal if you want to analyze trends in moderately volatile markets.
4. Adaptive Moving Average (AMA)🧠
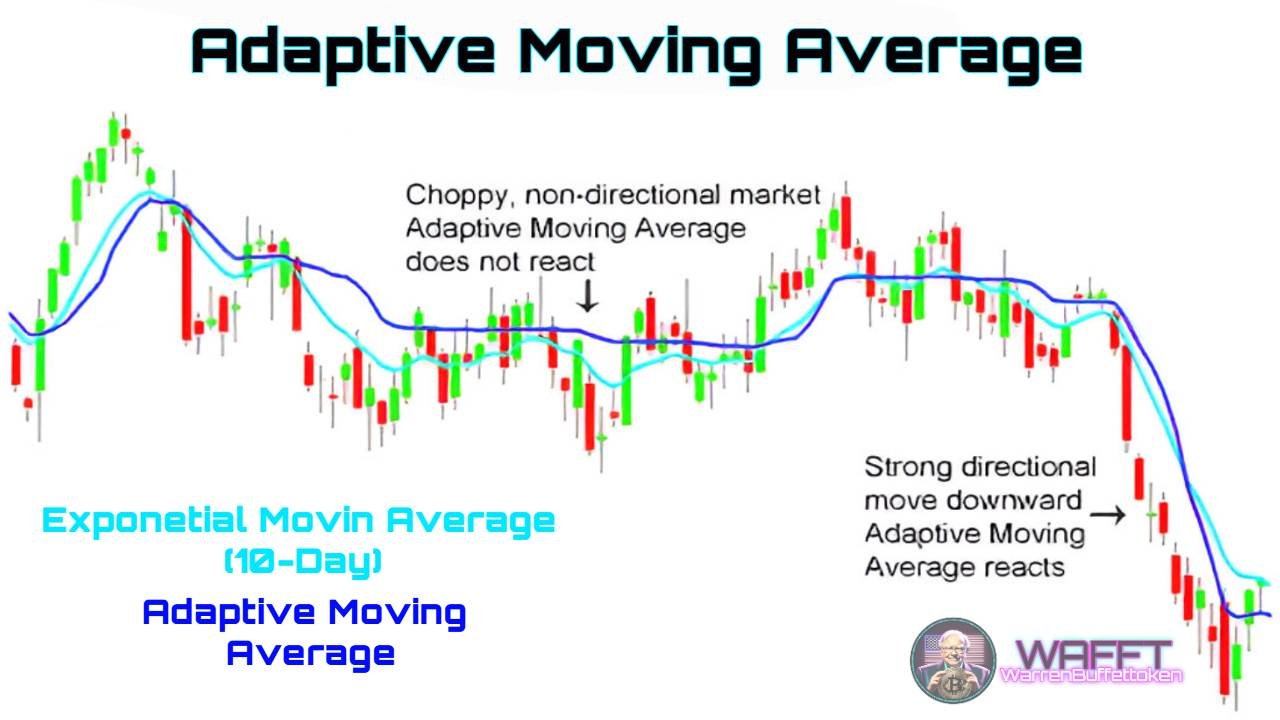
🔹What is it?
It is a "smart" moving average that automatically adjusts according to the speed of changes in the market. If the market is calm, it moves slowly; if it is volatile, it adapts quickly.
🔹How is it calculated?
- It uses a complex formula that takes into account volatility (how much prices change).
- It constantly adjusts to be more accurate.
💡Example:
Imagine you are watching the price of a video game you want to buy:
- If the price changes little, the AMA moves slowly.
- If there is a special offer and the price changes a lot, the AMA reacts faster to follow the new price.
🔹What is it for?
It is perfect for traders who want a tool that combines speed and accuracy.
- Very useful in markets where prices can change unpredictably (such as the Forex market).
5. Hull Moving Average (HMA)⚡️
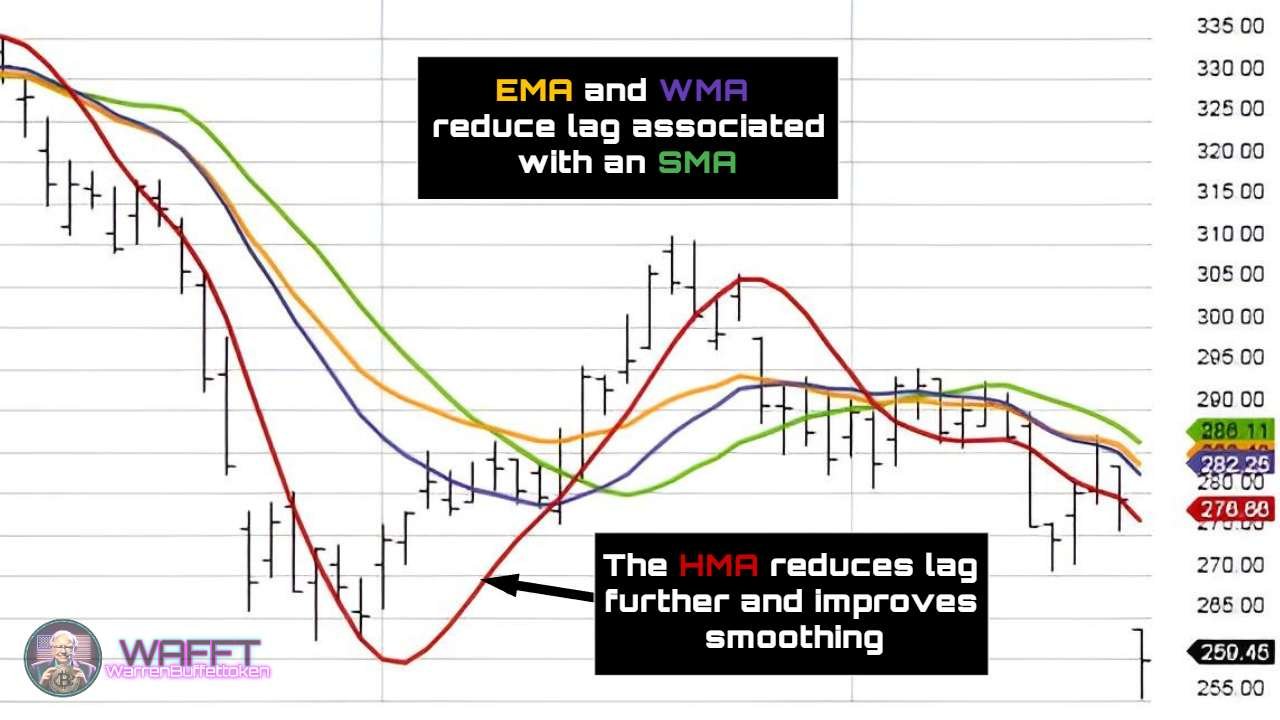
🔹What is the HMA?
The Hull Moving Average (HMA) is a moving average designed to reduce lag while keeping the price line smooth. The result? An ultra-fast and highly refined moving average, perfect for traders seeking quick reactions without losing precision.
🔹How is it calculated?
The HMA uses a more advanced method compared to standard moving averages:
- It applies Weighted Moving Averages (WMA) in two phases with different periods.
- It subtracts one WMA from another to highlight changes in price velocity.
- Finally, another WMA is applied to smooth the curve.
Though it may sound technical, the idea is to capture the trend as quickly as possible while avoiding market noise.
💡Example:
Context: Imagine you are tracking the price of a stock in the market. When the price rises slowly (perhaps because demand hasn't fully taken off), the HMA moves smoothly without the lag you’d experience with other moving averages. If suddenly the stock enters an uptrend due to positive news or increased demand, the HMA will quickly react to follow the trend without overwhelming you with excessive noise.
Now, picture yourself following the price of a tech startup's stock:
- When demand is moderate and the price rises gradually, the HMA (Hull Moving Average) moves smoothly without the lag seen in other moving averages.
- If the company announces a groundbreaking product and the stock price skyrockets, the HMA reacts much faster to capture the upward trend, helping you avoid confusion from market noise.
🔹What is it used for?
Identifying trends quickly: Thanks to its low lag, the HMA moves almost in sync with price changes.
- Filtering noise: It reacts fast but maintains smoothness to avoid distracting you with minimal price movements.
- Great for active traders: Intraday and swing traders appreciate that the HMA doesn’t "fall asleep" when detecting trend reversals.
Key Features of Different Moving Averages
💥 Straight from the WAFFTlab 💥
We ran an experiment, blending various elements together. The result? An explosive reaction that gave birth to this section—a concise comparison of the most popular moving averages:
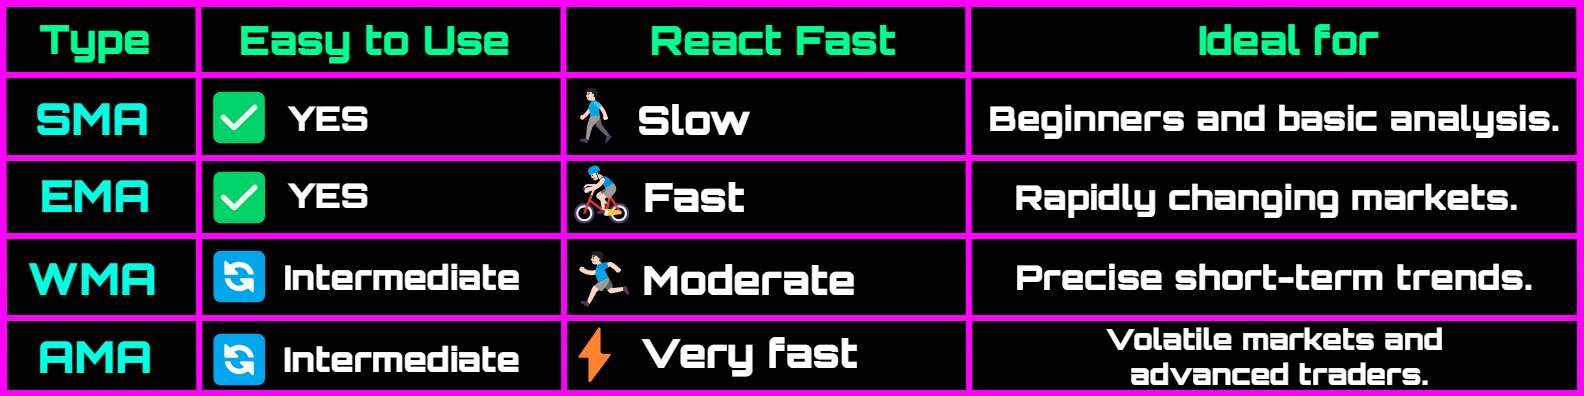
🔸SMA (Simple Moving Average)
Formula: Sum of prices / number of periods.- Pros: Easy to understand. Useful for identifying long-term trends.
- Cons: Significant lag when markets move quickly.
🔸EMA (Exponential Moving Average)
Gives more weight to recent data.- Pros: Reacts faster than the SMA.
- Cons: Can produce false signals in highly volatile markets.
🔸WMA (Weighted Moving Average)
Assigns increasing weights to more recent prices.- Pros: Offers precise control over weighting.
- Cons: Still slower than the EMA for sharp price movements.
🔸AMA (Adaptive Moving Average)🧠
Adapts to volatility. Moves slowly in calm markets and speeds up during volatility.- Pros: Smart adjustment to market conditions.
- Cons: Its formula is more complex and can lead to overfitting on short timeframes.
🔸HMA (Hull Moving Average)
Combines WMA and additional calculations to minimize lag and smooth the curve.- Pros: Very fast, with less noise than other rapid-moving averages.
- Cons: Requires advanced calculations and may not be available on basic platforms.
Never stop learning, and remember: financial education is the weapon most feared by the elites! Let’s go! ✨
Disclaimer: This content is for educational purposes only. Before using any indicator in live trading, research and test it in demo accounts. You are in control!
Summary of Moving Average Types📝
With these tools, you will better understand how an asset behaves and be able to make more informed decisions. It's that easy! 🎯
Advantages of Moving Averages: Your Ally in Trading!🌀

New to the world of trading or looking to simplify your analysis? 🚀 Moving averages are that indicator that never goes out of style and that everyone should know. Here I tell you why they are so great:
✨Super easy to understand
No complicated calculations or impossible-to-decipher charts. 📉 Moving averages give you a clear and simple view of what is happening in the market. Perfect for beginners! 😊
🌍They work for everything
It doesn't matter if you are trading stocks, cryptocurrencies, currencies or even commodities. 💰⚡ Moving averages work in any market and are equally effective.
🎯They filter out the noise
Tired of the constant ups and downs that make you dizzy? 🤯 Moving averages smooth out those small fluctuations and help you focus on what really matters: the main trend!
🚦Clear action signals
Buy or sell? 🤔 Moving average crossovers make it easy for you:
If the short-term average crosses up, it's time to buy! 📈
- If it crosses down, it may be time to get out. 📉
🔄They adapt to you
Are you more of a short-term or long-term strategy person? ⏳ Moving averages adjust to the time frame you prefer. Whether it's 20 days, 50 days or more, it's up to you! 🙌
🤝They go hand in hand with other indicators
Did you know that moving averages combine great with tools like the RSI or the MACD? 🛠️ This gives you extra confidence in your analysis and decisions. 💪
🧘♂️Less emotions, more strategy
The market can be a roller coaster of emotions. 😅 But moving averages, based on historical data, help you make decisions with a cool head.❄️
In short, moving averages are like that friend who always gives you good advice in difficult times. 🌟 So, what are you waiting for to include them in your trading strategy? 🙌
Limitations of Moving Averages: What You Need to Know🚧

While moving averages are amazing, they are not perfect. 😅 Like any trading tool, they have their limitations, and it is important to know them so as not to be surprised. Here I will tell you in a simple and direct way:
🐢They are a bit slow
Being indicators based on past data, moving averages can take a while to react to rapid market movements. 🚶♂️ This means that sometimes the signals come a bit late.
⚡They don't work in sideways markets
Is the market boring and moving sideways? 😴 Moving averages are not very helpful in these situations because they can generate false signals. Be careful not to blindly trust them at this time! 🚫
🤷♂️They don't predict the future
While they're great at identifying trends, they're not a crystal ball. 🔮 They can't tell you for sure what will happen next, they only show you what's already happening.
🔄Choose the period well or… goodbye accuracy
If you set a period that's too short, it'll give you a thousand false signals! 🤯 But if you choose one that's too long, you might miss important movements. Finding the balance is an art.🎨
🧩They work better with other indicators
On their own, they may not give you all the information you need. 🤔 That's why it's ideal to combine them with tools like the RSI or the MACD to avoid mistakes.
🎢They are affected by volatility
In super volatile markets, moving averages can make you dizzy with so many ups and downs. 🎢 This makes it harder to trust the signals they generate.
🕵️♂️They depend on your strategy
What works for one trader may not work for another.🤷♀️ If your strategy is very specific, moving averages might not be enough or not fit at all.
In short, moving averages are like a compass: useful to guide you, but they won't lead you straight to the treasure without a good map and other tools. 🗺️ Use them carefully and always in combination with other strategies! 💡
Strategies for Using Moving Averages🎮

Not only are moving averages easy to use, but you can also integrate them into super practical strategies to improve your trading decisions! 🚀 Here are some clear and applicable examples:
📈Trend Following
This strategy is ideal for markets with defined movements (bullish or bearish).
How to apply it?
Buy when the price is above the moving average.
- Hold the position as long as the price remains above it. 💼
- Sell or exit the position when the price crosses below the moving average.
Which one to use?
A 50-day simple moving average (SMA) is often popular for this type of analysis.
💡Practical example:
If the price of a stockis at $100 and the 50-day SMA is at $95, you are in a buy zone! But if the price drops to $94, it's an exit signal.
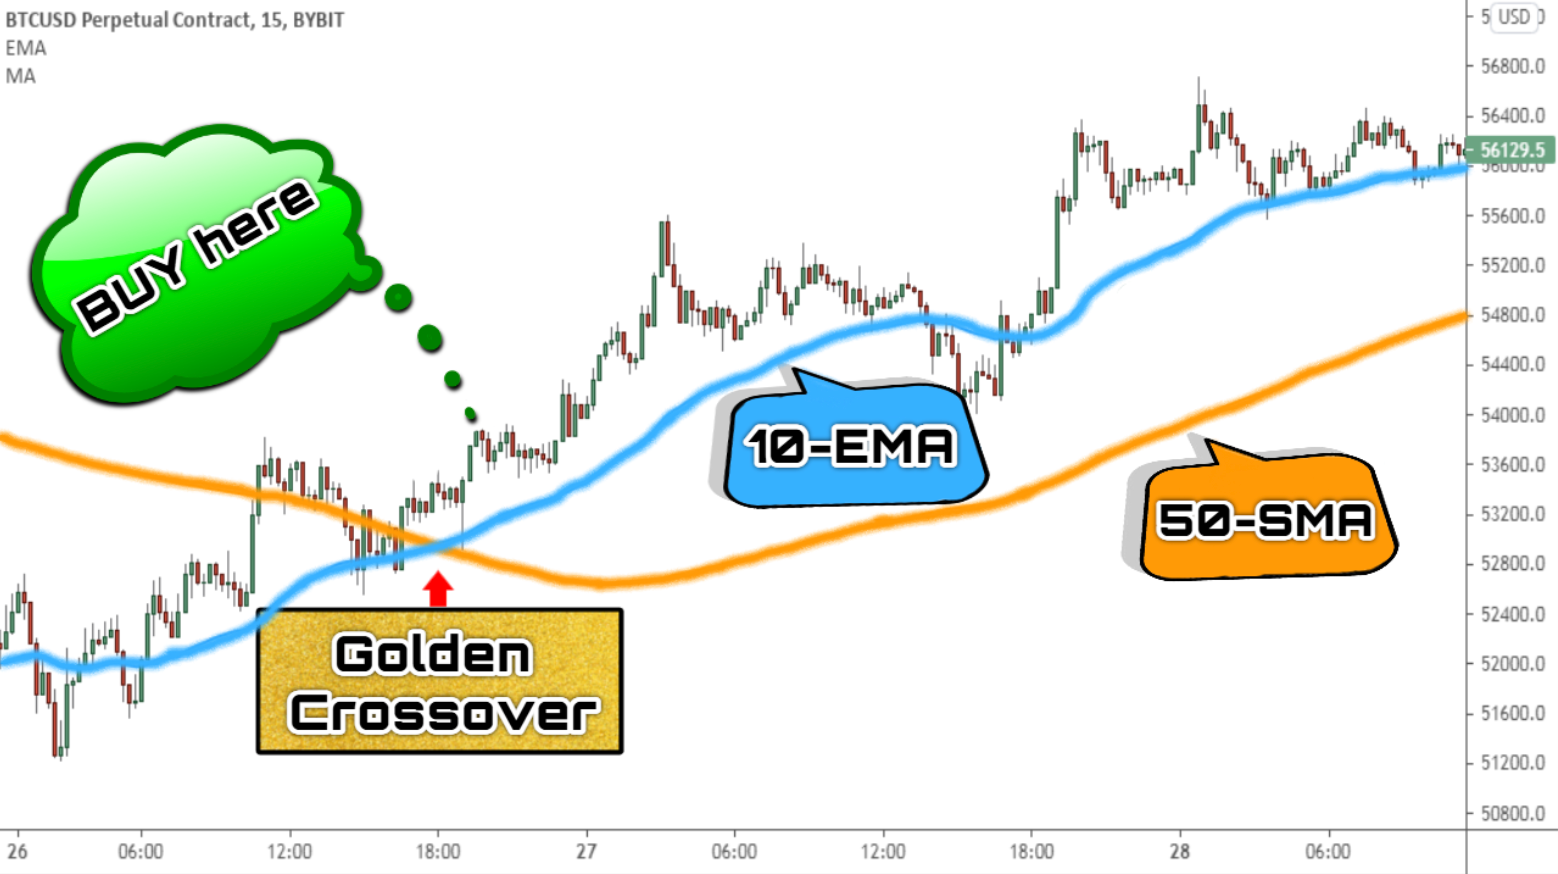
🔄Moving Average Crossover
Crossovers are a simple and powerful way to generate buy and sell signals.
How to apply it?
Use a fast average (like a 10-day EMA) and a slow average (like a 50-day SMA).
- Buy when the fast average crosses the slow average upwards. 📈
- Sell when the opposite happens: the fast average crosses downwards. 📉
💡Practical example:
Imagine that you use a 10-day EMA and a 50-day SMA on a cryptocurrency.
- If the EMA (10) crosses the SMA (50) upwards at $1,000, you buy.
- If the EMA then crosses the SMA downwards at $1,200, you sell and lock in profits.
🧩Confirmation with Other Indicators
Moving averages are great, but combining them with other technical indicators can make them even more effective. 💡
1. RSI (Relative Strength Index)
- Use the RSI to confirm the strength of the trend.
- Example: If the moving averages indicate buy, check that the RSI is not at overbought levels (>70).
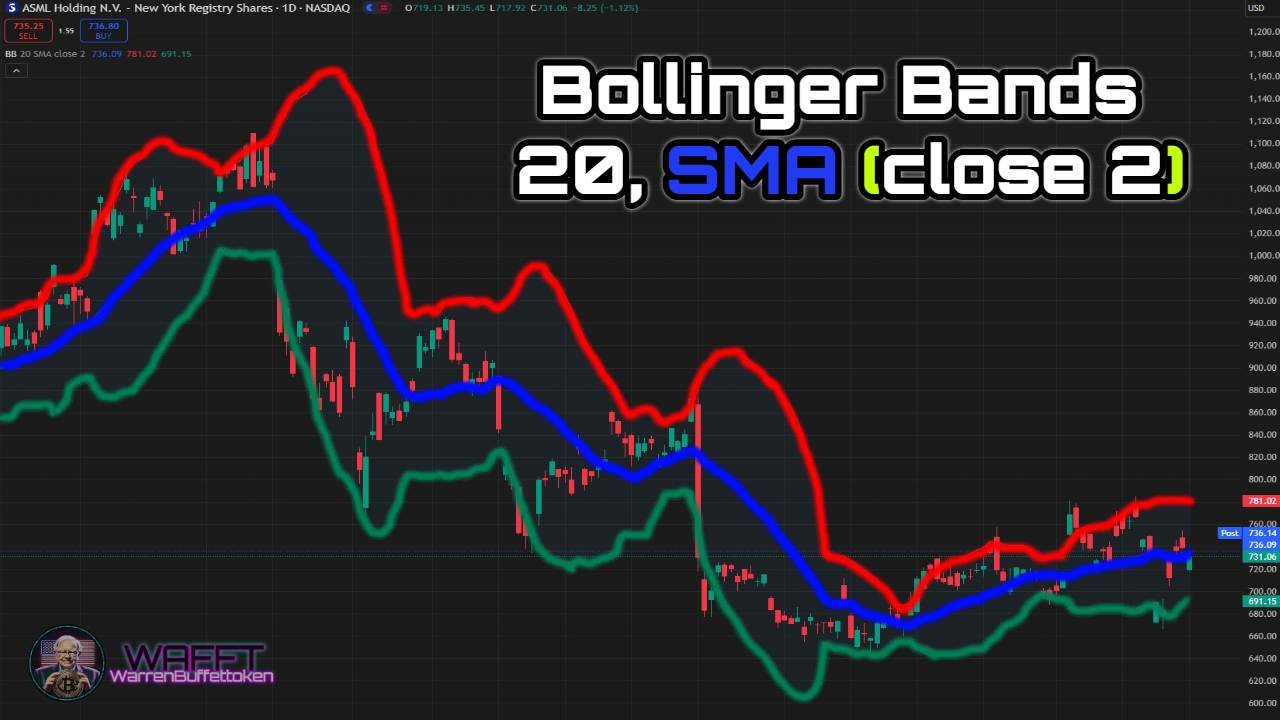
2. Bollinger Bands
Combine moving averages with these bands to detect breakouts or extreme price levels. 📏
- Example: If the price breaks the upper band and is above the moving average, it is a strong sign of bullish continuation.
⏳Long Term Strategy: 200-Day Moving Average
This strategy is perfect for investors who do not want to check the market every day.
How does it work?
Buy when the price is above the 200-day moving average.
- Sell when it is below.
Why is it useful?
The 200-day SMA is considered the "gold standard" for measuring the overall health of an asset.
💡Practical example:
If the price of the S&P 500 is above its 200-day moving average, it is a sign that the market is in good shape.
🎢Final Tips
1. Start with daily charts (1D):It is easier to identify trends and crossovers on larger time frames.
2. Practice with a demo account: Before risking real money, try these strategies in a risk-free environment. 🕹️
3. Avoid sideways markets: Moving averages can give false signals when there is no clear trend.
Moving averages are like multi-tools in your trading box. 🛠️ Use them wisely, and make them a key ally to make better decisions. Good luck in your investments! 🚀
Practical Example Explained for Easy Understanding🤑

Imagine you're looking at the Bitcoin chart, and the moving averages are your tools to decide when to enter or exit. Here we go step by step:
🔍What do you see on the chart?
1. The Bitcoin price goes up and crosses upwards the 50-day EMA (the magic line that tells you if it's on a roll).
- Think of the 50-day EMA as a "green light" indicator. 🚦
2. Furthermore, a golden cross occurs: the fast line (10-day EMA) goes up and crosses upwards the slow line (50-day SMA).
- It's like seeing that your two magic tools agree that something good is happening! 💫
3. To make sure, you check the RSI, which is at 45.
- This means that Bitcoin is not overbought (in other words, it is not too expensive yet).
🛠️What do you do with this information?
1. You take action:
- You open a long position (buy Bitcoin).
- This is like betting that the price will continue to rise. 📈
2. You protect yourself:
- You place a stop-loss just below the 50-day EMA.
- Think of the stop-loss as an "emergency parachute" 🪂 - if the price drops too much, your trade is automatically closed so that you don't lose much money.
3. You keep an eye on it:
- If the Bitcoin price crosses the fast moving average (10-day EMA) downwards, you decide to exit the game and close the trade. ❌
- This means that the signals have changed and it is better to protect your profits or avoid bigger losses.
🧠Simplifying it even further:
You see a green signal: the price is going up and crossing the lines. ✅
- You confirm that there is no extra risk: the RSI tells you that everything is normal.
- You act with a plan: you buy, but you prepare to exit quickly if something goes wrong.
With this example, understanding moving averages is like playing a video game: you analyze the scenario, use your magic tools, and make strategic decisions to win. It's that easy! 🎮✨
Tips for Using Moving Averages Like a Pro🧙♂️

Learning how to use moving averages is like becoming a market strategist! 📈 But to get the most out of them, here are a few tricks that will make you a trend master. 🛠️
🕒Try Different Periods
What does it mean?
- The period of a moving average is like the zoom of a camera. 📸
- A short period (like 10 or 20 days) is like zooming in: it shows you quick details, perfect for intraday trading.
- A long period (like 50 or 200 days) gives you a broad view, ideal for long-term investing or swing trading.
- The period of a moving average is like the zoom of a camera. 📸
💡Simple example:
If you're day trading, use a 10-day EMA to track fast movements. 🚀
- If you are more patient and prefer big moves, a 200-day SMA is your best friend. 🐢
🤝Combine them with Key Levels
What does it mean?
- Moving averages are great, but they don't work alone. Think of them as part of a team. ⚽
- Combine them with support and resistance levels, or chart patterns like triangles or double tops, to confirm your decisions.
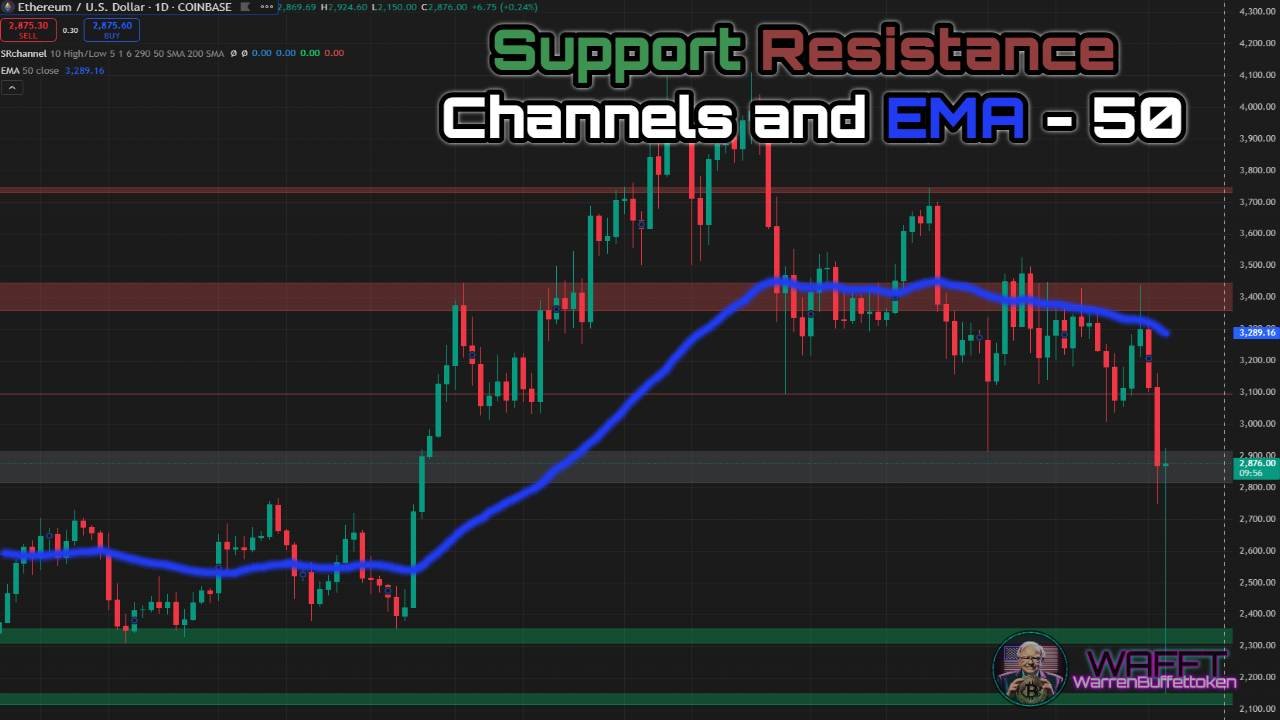
💡Simple example:
If the price is bouncing off a support line and at the same time crosses the 50-day EMA upwards, it's a strong buy signal! 💡
🧪 Practice Before Trading
What does it mean?
- Before using real money, practice with historical data (called backtesting). It's like testing your skills on a simulator before running in a real race. 🕹️
🎮 Simplifying Even More
1. Adjust your strategy: Use fast moving averages for quick plays (intraday) and slow ones for long plays (swing trading).
2. Play as a team: Combine moving averages with supports and chart patterns for more "power-ups". 🕹️
3. Test in training mode: Do backtesting so you don't jump into the market without knowing the rules of the game.
With these tips, using moving averages will be like having a map and a compass in the trading world. 🗺️ Start practicing and become a pro! 💼✨
Final Thoughts on Moving Averages🏁
Moving averages are a secret weapon in technical analysis. They are simple yet effective, ideal for spotting trends and making informed decisions. However, don't forget to combine them with other indicators and tools to maximize their effectiveness. Constant practice and risk management are key to success. 🎯
By incorporating moving averages into your strategy, you'll be adding a versatile tool that adapts to any market: stocks, cryptocurrencies, currencies, whatever you prefer! 🌐 Plus, by adjusting the periods according to your time horizon, you can customize their use for intraday trading, swing trading, or long-term investing. 🕒
Remember that no strategy is foolproof. Learn to identify the limitations of moving averages, such as lags in volatile markets or false signals in sideways ranges. That's why combining them with volume analysis, chart patterns, and other indicators such as RSI or Bollinger Bands will make your decisions much more accurate. 🤝
Don't worry if you find it difficult to read charts or understand how to react at first. The key is to practice, analyze your results, and adjust your approach based on what works best for you. 🎯
Success in trading is not just about the tools you use, but how you apply them with discipline and consistency. 💼 So, go ahead, experiment with moving averages, and get ready to take your trading to the next level! 🚀📊

And speaking of taking your skills to the next level, at WAFFT—the memecoin that truly provides educational value—you'll find a unique approach to financial education.
We're here to help you take full control of your finances and stop being just another pawn in the system!
But this doesn’t end here: in our next blog post, we’ll teach you about another trend indicator that will help you further boost your trading strategy. Get ready to become the investment expert the elites don’t want you to be!⚡️🚀