Stock index:
What is a stock market index? 📊
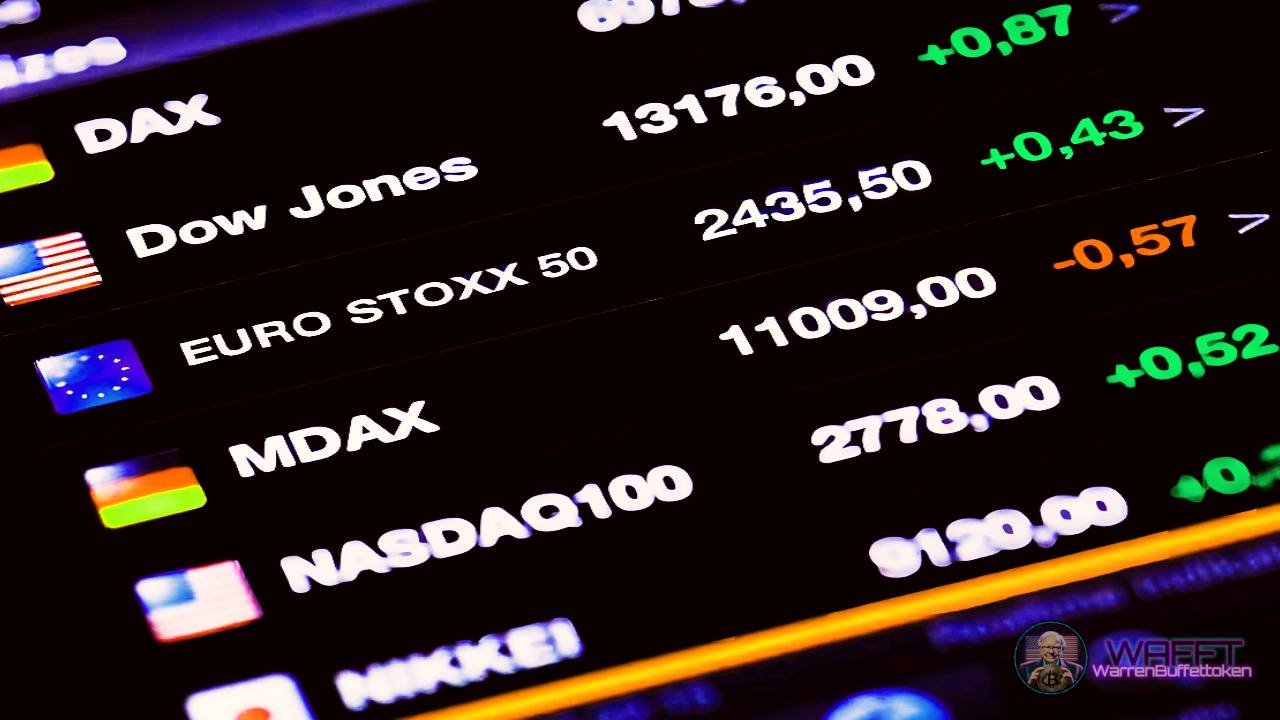
A stock market index is a financial indicator that reflects the performance of a set of stocks that represent a specific part of the market. It is used to measure the overall performance of the companies included in it, providing a clear reference on how a particular economy, sector or market is performing.
These indexes are essential for investors, analysts and economists, as they allow them to assess at a glance how certain groups of stocks are performing. For example, an index can focus on large technology companies, on the main companies in a country or on a sector such as energy or finance.
In short, stock market indexes act as an x-ray of the market. They help identify trends, assess risks and compare the performance of a specific investment against the market in general. In addition, they are essential tools for passive investment funds, such as ETFs, which replicate the performance of an index.
There are thousands of indices around the world, from the most global and well-known ones, such as the S&P 500 or the Nasdaq, to regional or sectoral indices, each with its own purpose and focus.
Let's break it down, as we usually do with everything.📖🚀
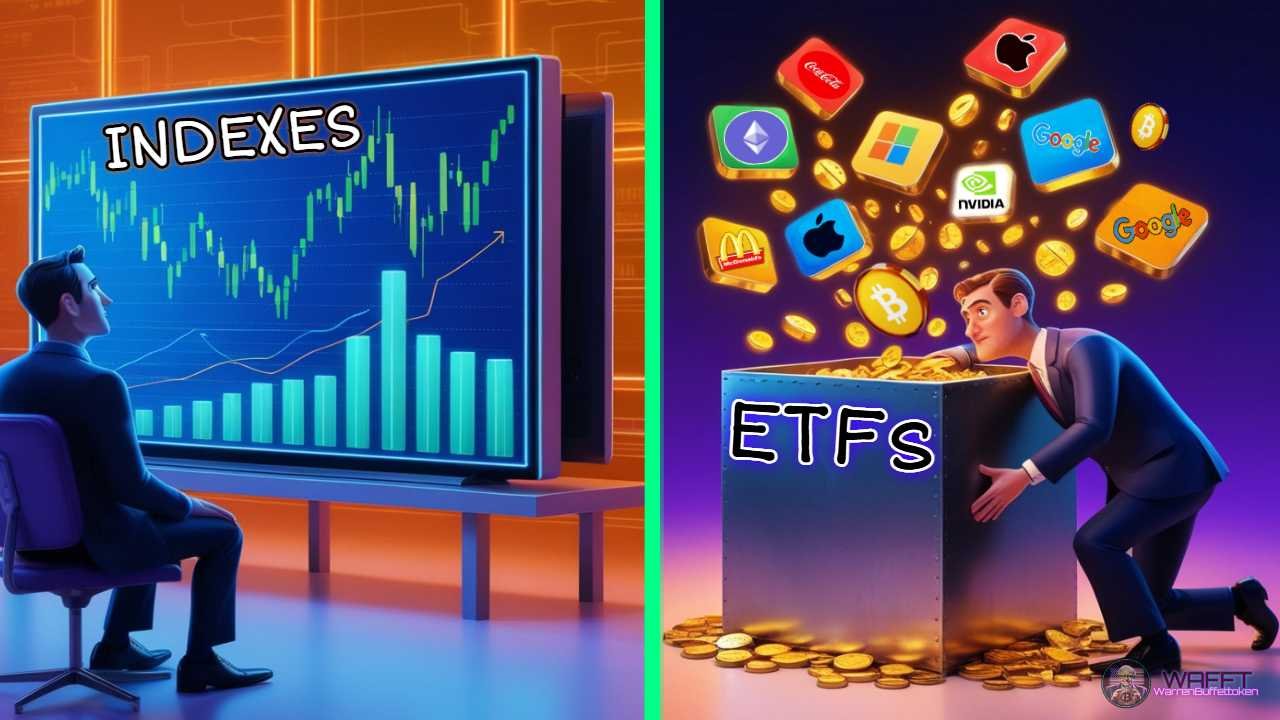
How is a stock index different from an ETF? 🤔📊
When you start exploring the world of investing, it's common to come across terms like "stock index" and "ETF" which, although related, are not the same. Here we're going to break down their differences so you understand what role each plays in finance and how they can help you achieve your goals.
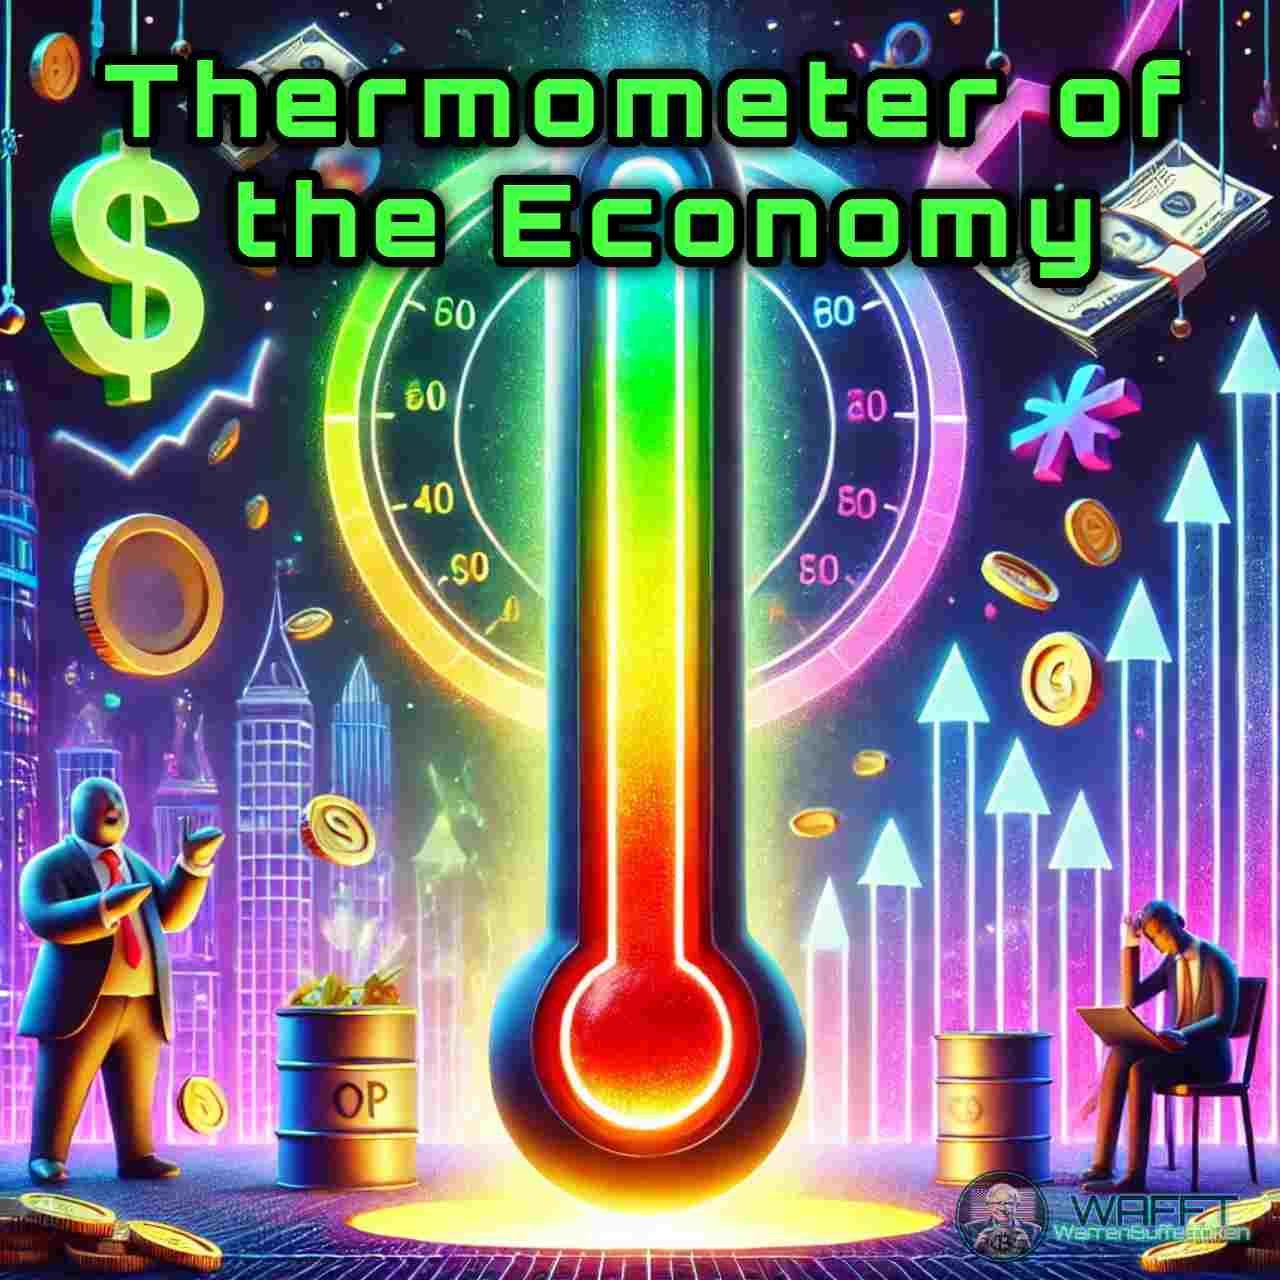
Stock index: A market thermometer 🌡️
A stock index is a financial indicator that reflects the performance of a set of assets, such as stocks or bonds. It serves to measure the performance of a sector, market or region. For example, the S&P 500 tracks the 500 largest companies in the US, while the Ibex 35 analyses the 35 largest companies in Spain.
The index, however, is theoretical: you cannot buy it directly or "own" it. Its main function is to act as a reference for evaluating markets, designing investment strategies or comparing portfolios.
ETF: Invest in the market instantly 💼💰
On the other hand, an ETF (Exchange Traded Fund) is a financial instrument that replicates the performance of an index, sector or strategy. By investing in an ETF, you buy a real share in a fund that owns the underlying assets of the index. For example, the SPY ETF follows the S&P 500, and when you invest in it, you have access to all the companies that make up this index.
Unlike indices, ETFs are assets that are bought and sold on the stock exchange, as if they were shares. This makes them very accessible, both for novice and experienced investors.
Key differences 🛠️
1. Nature:
A stock index is an indicator, while an ETF is an investment product.
2. Accessibility:
Indexes are only reference values. Instead, ETFs allow you to actively participate in the market.
3. Costs:
Indexes have no associated costs for the investor, but ETFs include management fees (expense ratio) and spreads, although they are usually inexpensive.
4. Trading:
Indexes are not traded; ETFs are, and they do so during market hours, offering liquidity and flexibility.
An analogy to understand it better 🍴
Stock index = shopping list:
Imagine that you want to prepare a pizza. A stock index is like a list of ingredients that tells you what things you need: flour, tomato, cheese, etc. It is only a reference to know what to buy, but it does not include the ingredients or the work of putting them together.
ETF = ready-made pizza:
Now, if you do not want to spend time buying the ingredients and cooking, you can go to a store and buy a pizza already made and ready to eat. That's what an ETF is: someone has already taken the assets (stocks, bonds, etc.), combined them for you, and offers them to you as a finished product.
In short:
The index is just a theoretical guide, it tells you which assets should be on your "financial pizza."
The ETF is the practical product, ready for you to acquire directly without worrying about putting it together yourself.
It's that easy! 🍕📊
Conclusion: Different, but complementary 🌐
Stock index and ETFs are essential tools in finance, but they serve different functions. While an index is a reference for analyzing markets, an ETF is your gateway to participating in them.
If you are looking to invest in a simple and diversified way, ETFs can be your best ally, as they combine the informative power of indices with the accessibility of a financial product.
Get to know both, and you will be better prepared to make smart decisions! 🚀
How does a Stock Index work? 🔍
A stock index is a weighted average of the stocks that make it up, designed to reflect the overall performance of a market, sector or economy. Although it looks like a simple number, its calculation can vary depending on how the index is designed, and each type has its peculiarities.
Types of calculation:
1. Price-weighted indexes:
In this type, the price of each stock determines its weight in the index. The higher the price of a stock, the more it will influence the total value of the index, regardless of the actual size of the company.
- Advantage: It is easy to calculate and understand.
- Disadvantage: It can give excessive weight to companies with expensive stocks, even if they are not the most representative.
Easy example:
Suppose an index has two companies:
- Company A with shares at $200.
- Company B with shares at $20.
Even though Company B is much larger, its impact on the index will be much smaller than Company A because of its share price.
Popular index: The Dow Jones Industrial Average (DJIA).
2. Market-cap weighted indexes:
Here, the weight of each stock is based on the total value of the company (number of shares outstanding × share price). Larger companies have more influence on the index.
- Advantage: More accurately represents the impact of large companies on the market.
- Disadvantage: Small companies can be almost irrelevant in the calculation.
Easy example:
Imagine an index with two companies:
- Company A, with 1 million shares at $50(cap: $50 million).
- Company B, with 10 million shares at $10 (cap: $100 million).
Even though A's stock price is higher, B will have more weight in the index because its total market value is higher.
Well-known index: The S&P 500.
3. Equal-weighted indexes:
In this model, all stocks have the same weight, regardless of their price or capitalization. This gives a balanced approach where each company counts equally.
- Advantage: It does not depend on the size or price of the stock.
- Disadvantage: It may not represent the reality of the market well, since a small company can have as much influence as a giant.
Easy example:
An index with three companies (A, B and C), regardless of their prices or capitalization, will allocate the same 33.3% to each. If A grows by 10%, but B and C fall by 5%, the index will have an average return based on these percentages.
Popular index: Equal-weighted alternative indexes such as the Equal-Weighted S&P 500.
Factors that affect the movement of an index
1. Changes in stock prices:
Every stock in the index contributes to its movement. If the stocks of large companies go up or down, the index will reflect that impact.
- Example: If Apple (a large component of the S&P 500) goes up 5%, it will have a much larger impact on the index than a smaller company.
2. Adjustments to index composition:
Indexes are not static. Companies that do not meet the established criteria are replaced by more relevant ones.
- Example: In 2020, Tesla joined the S&P 500, displacing another company due to its large capitalization and relevance.
3. Macroeconomic factors:
Economic news, interest rates, inflation, and global political events can influence the stocks that make up an index.
- Example: If central banks announce a low interest rate policy, indexes often rise because this favors companies.
What does it mean when an index goes up or down?
If the index goes up:
- It's a sign that, on average, the companies in it are gaining value. This can reflect positive market sentiment or good economic prospects.
- Example: A 2% rise in the S&P 500 suggests that the top 500 U.S. companies, as a whole, have gone up in value.
If the index goes down:
- It indicates that companies are losing value on average, which could be due to uncertainty or negative economic events.
- Example: A 3% drop in the Nasdaq can be a reflection of losses in major technology companies, such as Microsoft or Amazon.
Fun facts:
- You can't buy an index directly: Although an index measures market performance, you need to use products like ETFs or index funds to invest in it.
- Economic indicators: Indexes serve as a benchmark for governments, analysts, and investors on the health of the economy.
- First stock market index: The Dow Jones, created in 1896, is one of the oldest and best-known indices in the world.
In short, a stock market index is much more than just a number; it is a mirror of the market that guides investors, analysts and entire economies in their decisions. 🌍📊

What is a Stock Market Index for? 📈
Stock market indexes are fundamental tools in the financial world. Although at first glance they seem like simple numbers, their usefulness goes much further. They function as a compass for investors, analysts and economists, helping to interpret the state of markets and economies.
Below, we explain their main uses:
1. Measure market performance
A stock market index reflects the performance of a group of stocks representative of a market or sector. Its behavior allows us to identify general trends, such as:
- Bull market: When the index rises steadily, it indicates optimism and increasing investment.
- Bear market: If the index falls, it suggests uncertainty, massive sales or recession.
- Practical example:
If the S&P 500 index increases by 10% in a year, it is interpreted that the main American companies, on average, have grown by that percentage.
- Practical example:
2. Investment benchmark
Indexes serve as a benchmark for many financial products. Mutual funds and ETFs are often designed to replicate the performance of a specific index, allowing them to offer diversified exposure in a simple way.
- Practical example:
An ETF that replicates the Nasdaq-100 index allows you to invest in major US technology companies, such as Apple, Amazon and Tesla, with a single transaction.
- Practical example:
3. Comparative analysis
Investors and fund managers use indices to compare the performance of their portfolios. If the portfolio underperforms the index, it may be a sign that it is not being managed efficiently.
- Practical example:
If your portfolio gains 5% in a year but the S&P 500 index rises 10%, it is time to analyze your strategies or reconsider your investment approach.
- Practical example:
4. Indicator of the state of the economy
Some indices, especially those covering a large number of companies, are seen as key indicators of the economic health of a country or region. A rising index often reflects business confidence and a favourable economic environment.
- Practical example:
When the UK's FTSE 100 index rises, it can be interpreted that the country's largest companies are growing, suggesting a positive economic environment.
- Practical example:
5. Facilitating access to international markets
Stock indices also help investors gain a clear view of the performance of international markets. This is especially useful for diversifying portfolios.
- Practical example:
The MSCI Emerging Markets index allows you to analyse and access emerging markets such as China, India and Brazil without having to study each stock individually.
- Practical example:

6. Risk management and advanced strategies
In trading, indices are used to create hedging strategies or to speculate on the future direction of a market.
- Practical example:
A trader can buy Nasdaq-100 index futures if he believes the technology sector will grow, or sell futures to protect against a possible market decline.
- Practical example:
7. Tracking specific sectors
There are indices that focus on specific sectors or industries, making it easier to analyze and invest in specific areas of the economy, such as technology, health or energy.
- Practical example:
The NYSE Arca Oil & Gas index measures the performance of companies in the energy sector, ideal for those who want to invest in oil and gas.
- Practical example:
In summary
A stock market index is not just a number; it is a key tool for measuring, comparing and analyzing the market and the economy. For investors, it is a strategic ally that simplifies decisions and helps to follow global trends more clearly. 🌍📊
Major Stock Market Indices in the World 🌍💹
In this article, we are going to break the mold (as we always do 😉). We present you 9of the most important stock market indices in the world, yes, just 9! Because, let's be honest, everyone goes for the typical “top 10”and we are not here to follow boring trends. At WAFFT we are different, disruptive and, above all, authentic 💥.
So, sit back, get ready for a unique tour of the giants of the financial world and discover why these indices are the lifeblood of the global market. Ready for a dose of knowledge in style? 🚀
Stock market indices are like financial thermometers that show us the state of the markets in different parts of the world. Some stand out not only for their economic influence, but also because they reflect the trends and movements of the largest economies on the planet.
Here is a review of the most important ones:
1. S&P 500 (USA) 🏛️
It is one of the most popular and followed indices in the world. It includes the 500 largest companies in the United States, covering a wide variety of sectors such as technology, health, finance and energy.
📌Fun fact: This index is a key indicator of the American economy and the global market. Companies such as Google, Tesla and Johnson & Johnson are part of it.
2. Dow Jones Industrial Average (USA) 🏗️
Created in 1896, it is one of the oldest and most recognized indices. It is made up of 30 key companies in the US economy.
Features:
- Weighted by price, meaning that higher-priced stocks have more influence on their value.
- Companies included: Coca-Cola, McDonald’s, Apple, and Boeing.
📌Interesting fact: Despite its limited number of companies, it remains a relevant indicator of the US industrial and business sector.
3. Nasdaq Composite (US) 🚀
This index is synonymous with technology. It includes more than 3,000 companies, many of them tech giants like Apple, Amazon, and Microsoft.
Particularities:
- It mainly represents technology and innovation companies.
- It also includes biotechnology and telecommunications companies.
📌Fun fact: During the tech bubble of the late 1990s, this index reached historic highs that took years to recover.
4. FTSE 100 (UK) 🇬🇧
Made up of the 100 largest companies listed on the London Stock Exchange, it is the benchmark for measuring the performance of the British market.
Featured companies:
- BP (energy), HSBC (finance) and Unilever (consumer products).
📌Relevant fact: It often reflects not only the state of the British economy, but also global trends, as many of these companies have international operations.
5. Nikkei 225 (Japan) 🇯🇵
Asia's most famous index, it includes 225 leading companies listed on the Tokyo Stock Exchange.
Sectors represented:
- Electronics (Sony, Panasonic).
- Automobiles (Toyota, Honda).
- Finance.
📌Fun fact: This index is weighted by price, like the Dow Jones, which means that more expensive stocks have a greater impact.
6. EuroStoxx 50 (Europe) 🌍
The EuroStoxx 50 is the leading stock market index in the Eurozone, representing the 50 largest and most liquid companies from 11 countries that share the euro as their currency. These companies span various industries, including technology, finance, energy, and consumer goods, giving a broad perspective of the region's economic health.
If you're wondering how this index works, let's break it down⬇️
📌 The companies included are selected based on their market capitalization and liquidity, making it a benchmark for investors interested in Europe's economic powerhouse. Countries like Germany, France, and Spain dominate the list, with major players like Airbus, TotalEnergies, and Siemens included.
📌 Fun fact: The EuroStoxx 50 is not just an indicator of the European economy; it's also used as a reference for a wide range of financial products, including ETFs and derivatives, making it a favorite for investors looking to diversify within Europe.
The EuroStoxx 50 is more than just numbers on a screen; it serves as a pulse of the Eurozone's economic vitality. It showcases the resilience and growth of Europe’s corporate giants, reflecting the region’s global influence. 🌟
7. DAX 40 (Germany) 🇩🇪
Represents the 40 largest companies listed on the Frankfurt Stock Exchange. It is the benchmark index for Europe's largest economy.
Featured companies:
- BMW, Siemens, Adidas and Deutsche Bank.
📌Key fact: Its composition is reviewed periodically to ensure that it continues to reflect the performance of Germany's most relevant companies.
8. FTSE China A50 Index (China) 🏯
The FTSE China A50 is the benchmark index of the Chinese stock market, designed to track the 50 largest and most liquid domestic companies listed on the Shanghai and Shenzhen stock exchanges. These shares, known as "A-shares," are denominated in Chinese yuan and represent the best of China's domestic market.
If you don't know what a domestic market is, don't worry, we'll explain it to you⬇️
📌The domestic market of a country, in this case China, refers to the set of all financial, commercial and industrial activities that take place within China's borders, specifically those related to companies and products aimed at consumers and the country's internal markets.
📌 Fun fact: This index not only measures the health of the Chinese stock market, but also reflects the growth and changes of its economy. Among its giants we find names such as ICBC (the largest bank in the world) and China Merchants Bank, pillars of key sectors such as finance, technology and consumption.
The FTSE China A50 is not only a thermometer of the market, but a window into the dynamics of a vibrant and constantly evolving economy, consolidating itself as an essential tool for global investors seeking exposure to this Asian giant. 🌏
9. MSCI Emerging Markets 🌏
Although it is not a single-country index, it includes companies from emerging markets such as China, Brazil, India and South Africa. It is key for those looking to diversify their investments globally.
📌Interesting fact: It represents growing economies, which often have great potential for returns, but also associated risks.
Why are these indices important?
Each of these indices acts as a window into the economic and corporate performance of its region or sector. In addition, they are essential tools for investors and analysts looking to understand global trends and make informed decisions.🌟
Investing in these indices, through ETFs or other vehicles, allows access to diversified exposure and the potential benefits of economic growth in each region or sector. 💼✨

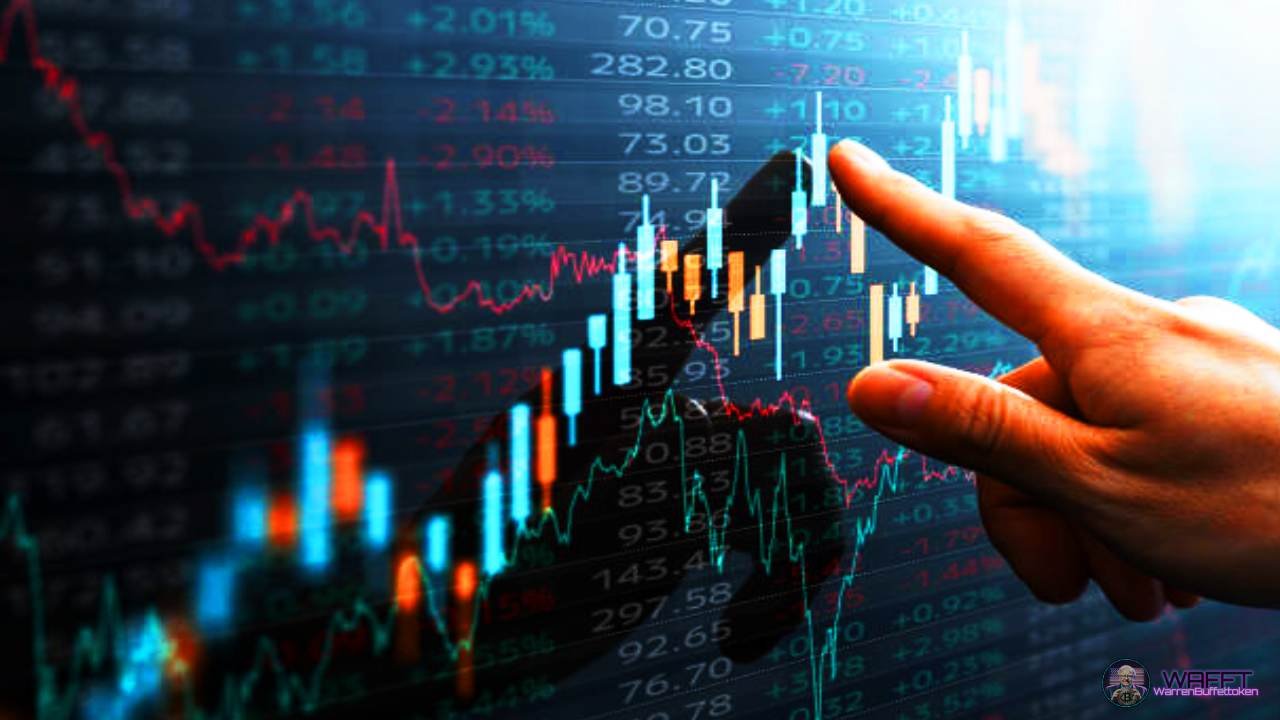
What Moves a Stock Index? 🌐📉📈
The value of a stock index is not static; it moves like a dancer, influenced by various economic, political and emotional factors.
Here's what makes it spin, rise or fall:
1. Financial results of companies 🏢💼
A stock index is made up of the shares of several companies. If these companies report solid earnings, launch innovative products or exceed analysts' expectations, the index may rise. On the other hand, if the results are disappointing, the index will suffer.
📌Easy example: If Apple (part of the S&P 500) launches a revolutionary iPhone that breaks sales records, the index is likely to rise thanks to its performance.
2. Macroeconomic changes 📊💰
Factors such as interest rates, inflation, and central bank decisions (such as the Federal Reserve or the European Central Bank) have a significant impact.
- Low interest rates: Loans become cheaper, companies invest more, and indexes often rise. 📈
- High inflation: It can create uncertainty and cause the index to fall. 📉
📌Fun fact: When the Fed announces an unexpected change in rates, markets tend to go crazy – in a matter of seconds!
3. Global events 🌍⚡
The world is full of surprises, and stock indices react quickly:
- Political crises: An unexpected change of government or international tensions can create fear among investors.
- Technological discoveries: A breakthrough in artificial intelligence, renewable energy or biotechnology can excite the market.
- Pandemics or natural disasters: Uncertainty and economic impact often cause indices to fall.
📌Recent example: In 2020, COVID-19 shook global markets, leading to historic declines followed by recoveries driven by economic stimulus.
4. Market sentiments 🤔💭
The financial market is also full of emotions. Investors' expectations and psychology play an important role:
- If investors are optimistic and believe that the economy will grow, indices rise. 🌞
- If pessimism reigns due to fear of a recession, indices fall. 🌧️
📌Fun fact: The famous phrase "buy the rumor, sell the news" reflects how expectations can move markets before anything even happens.
Bottom line... 📝
A stock index is like a mirror that reflects what's happening in the business, economic, and social world. Its value is constantly moving, influenced by cold numbers (financial results), power decisions (macroeconomic changes), big stories (global events), and the emotional beat of investors (market sentiments).
So the next time you see an index rise or fall, think about all the gears that are turning behind it. 🛠️✨

What should you know before using an Index? 📚📈
A stock market index can be a powerful tool for investors, both beginners and advanced. But, like everything in the financial world, it is essential to understand how it works and what its implications are before using it as a reference or investing in related products.
Here I detail what you need to know to make the most of stock market indices.
1. It is not an asset in itself ❌💵
An index cannot be bought or sold directly because it is, basically, a metric. It represents a weighted average of the performance of a group of stocks. However, you can invest in products that replicate it, such as:
- ETFs (Exchange Traded Funds): They work as a "copy" of the index that you can buy and sell like any stock.
- Index funds: Managed investment vehicles that seek to match the performance of the index, ideal for those who prefer a passive strategy.
📌Practical example: You can't buy the S&P 500, but you can buy the "SPY" ETF, which tracks it to the letter.
2. Smart diversification 📊🌐
An index is made up of many companies, which automatically makes it diversified. However, not all indexes are created equal:
- Some, like the S&P 500, cover multiple sectors, from technology to healthcare to consumer.
- Others, like the Nasdaq 100, focus on a single sector or type of company (in this case, technology).
🗝️Key: Check the composition of the index. Even if it's diverse, it may have a strong bias toward certain sectors or regions.
📌Practical example: If you invest in the Nasdaq 100, you're betting primarily on technology, so if that sector falls, your investment will suffer as well.
3. Volatility: Not everything is stable ⚡📉📈
Although indices are a good reference for the general market, they are not free of risks. Their volatility can vary depending on:
- The type of index: Broad indices, such as the MSCI World, tend to be more stable, while specific indices, such as the Nasdaq Biotechnology, can have large swings.
- External events: Changes in interest rates, political decisions or financial results of key companies can move an index quickly.
📌Practical example: The Dow Jones is more stable than the Nasdaq 100 because it includes established companies from different sectors, while the Nasdaq depends more on technology startups.
4. Use as a reference: Benchmarking 🧭
Indexes are ideal for measuring the performance of your investments. If you are investing in a fund or managing your own portfolio, you can compare it to a similar index:
- If your portfolio is performing better than the index, well done! 👏
- If it is performing worse, it might be time to rethink your strategy.
📌Fun fact: Actively managed funds often fail to outperform the indexes they try to beat. That's why many investors prefer ETFs that replicate indexes.
5. Know the associated costs 💰
Although indexes themselves have no costs, the products that replicate them do. When investing in an ETF or index fund, check:
- Administration fees: Although they are usually low, some products may have higher commissions.
- Spreads: In the case of ETFs, the cost between the purchase and sale price can add up if you trade frequently.
📌Practical example: An ETF like the "SPY" has a very low annual management fee (around 0.09%), while an index fund might be a bit more expensive.
In short... 📝
Using a stock market index as an investment tool or reference has great advantages, but it is crucial to understand what you are buying (or not buying). Evaluate its composition, volatility, costs and the product you choose to replicate it.
Indexes can be a great way to start investing in a diversified way, but as with everything in finance, do your research before you take the leap! 🚀✨

History of Stock Market Indices 🕰️💹
The history of stock market indices is fascinating and reflects how markets evolved to become more accessible and understandable to everyone. It all started with a revolutionary idea: how to summarize the behavior of a market full of companies and stocks in a single number?
Spoiler: they succeeded, and in what a way! Let's dust off this story.
The birth of the first index: Dow Jones Industrial Average 🌟🚂
The year was 1896, when Charles Dow and Edward Jones, two visionaries of the financial world, decided to create the Dow Jones Industrial Average (DJIA). Their goal was simple but powerful: to measure the performance of the main industrial companies in the United States.
- Which companies were part of it? At first, the DJIA included only 12 companies, mostly industrial: steel mills, railroads and cotton manufacturers. It was a reflection of the economy of the time, deeply rooted in heavy industry.
- How did it work? Very simple: they added up the stock prices and divided them by 12 (no weighting or complicated formulas).
📌Fun fact: Today, the DJIA includes 30 giant companies from various sectors and uses a more complex formula, but it remains one of the most influential indexes in the world.
The Golden Years of Indexes: The S&P 500 Enters the Game 🚀📈
In 1957, a true icon was born: the S&P 500. This index revolutionized the market by including 500 companies from different sectors and, most importantly, by weighting them by their market capitalization.
- What does this mean? Larger companies, such as Apple or Microsoft today, have a greater weight in the index than smaller companies.
- Why was it a milestone? It allowed for more accurate tracking of the overall performance of the economy, ushering in a new era in indexes.
📌Fun fact: The S&P 500 is so influential that it is considered a "thermometer" of the American economy. If the S&P goes up, everyone celebrates; if it goes down, there are long faces.
Globalization comes to indices 🌍📡
With globalization and technological advances, indices were no longer exclusively local. From the mid-20th century, international indices emerged that allowed investors to follow the performance of markets around the world:
- Nikkei 225 (1950): The heart of the Japanese market and a reflection of the Asian economy.
- MSCI World (1969): A global index that includes companies from more than 20 developed countries.
- FTSE 100 (1984): Represents the 100 largest companies in the United Kingdom.
📌Why are they important? These indices made it possible for investors to diversify their portfolios globally, something that was practically impossible before.
The digital age and modern indices 💻📱
The advent of technology in recent decades has transformed the way stock indices are created and used:
- Real-time trading: In the past, indices were calculated manually and data took a while to arrive. Today, thanks to technological advances, indices are updated in real time, second by second.
- Sector and thematic indices: Today you can find indices that follow specific sectors (such as technology or energy) or even themes such as sustainability (for example, the MSCI ESG Leaders).
📌Modern example: The Nasdaq 100, known for including tech giants such as Apple, Amazon and Tesla, is a key benchmark for the innovation sector.
The cultural and financial impact of indices 🏛️✨
Beyond their financial utility, stock indices have become symbols of economic stability (or instability). Some, like the S&P 500, are monitored not just by investors, but also by governments, central banks, and economists to assess the state of the economy.
📌Did you know...? When you hear in the news "the market is up today," they're usually referring to how indexes like the S&P 500, Dow Jones, or Nasdaq moved.
More additional information about the Most Important Stock Market Indices in the World 🌍📈
Dow Jones Industrial Average (DJIA) 🌟
- Creators: Charles Dow and Edward Jones.
- Foundation: 1896, United States.
- Characteristics: It is one of the oldest indices in the world. Made up of 30 highly relevant companies in the US, it was initially focused on the industrial sector.
- Importance: It serves as a barometer of US economic performance.
Nikkei 225 🇯🇵
- Creator: Nihon Keizai Shimbun (Nikkei).
- Foundation: 1950, Japan.
- Characteristics: Made up of 225 Japanese companies, weighted by price.
- Importance: It is the main indicator of the Japanese market and a thermometer for Asia.
S&P 500 📈
- Creator: Standard & Poor’s.
- Foundation: 1957, United States.
- Characteristics: It includes the 500 largest companies in the US, weighted by their market capitalization.
- Importance: It is the benchmark index most used by investors and fund managers.
MSCI World 🌐
- Creator: Morgan Stanley Capital International (MSCI).
- Foundation: 1969, United States.
- Characteristics: Monitors more than 1,500 companies in 23 developed countries.
- Importance: Ideal for understanding the global performance of developed markets.
Nasdaq Composite 🚀
- Creator: Nasdaq Stock Market.
- Foundation: 1971, United States.
- Characteristics: It brings together more than 3,000 companies, with a strong focus on technology and innovation.
- Importance: It is the benchmark for measuring the performance of technology companies.
FTSE 100 🇬🇧
- Creators: London Stock Exchange and Financial Times.
- Foundation: 1984, United Kingdom.
- Characteristics: It includes the 100 largest companies listed on the London Stock Exchange.
- Importance: It reflects the performance of the British market and has significant weight in Europe.
DAX 40 🇩🇪
- Creator: Frankfurt Stock Exchange.
- Foundation: 1988, Germany.
- Characteristics: Represents the 40 largest German companies, weighted by market capitalization.
- Importance: It is the leading index in Europe, known for its focus on industrial and technology companies.
FTSE China A50 Index 🐉
- Creator: FTSE Russell (Global index company providing benchmarks, analytics and data solutions for investors worldwide).
- Founded: 2003, China.
- Features: Tracks the 50 largest and most liquid companies listed on the Shanghai and Shenzhen stock exchanges, focusing on yuan-denominated "A-shares". Adjusts for market capitalization and free float liquidity.
- Significance: Serves as a benchmark for China's domestic market and provides insights into sectors such as finance, technology and consumer goods. It is a vital tool for global investors seeking exposure to the Chinese economy.
In short... 📝
Stock market indices are more than just numbers; they are a window into the past, present and future of the global economy. From the days of the railroads in the 19th century to the technological titans of the 21st century, indices have evolved to be indispensable tools for investors, economists and the curious alike.
The next time you hear about the "Dow," the "S&P" or the "Nasdaq," remember that behind those names is a fascinating story of innovation and financial evolution. 🚀📈
Final Summary 📝
Stock indices are essential tools for anyone interested in financial markets. They offer a global view, allow for evaluating trends, and facilitate access to diversified investments. Since their creation in the 19th century, they have evolved to adapt to an increasingly interconnected and digital world.
Understanding how they work not only helps you make better investment decisions, but also connects you to the history and dynamics of the global financial system.
So, the next time you hear about the S&P 500 or the Nikkei 225, you'll already know that behind those numbers there is a fascinating story of interconnected markets, companies, and economies. 🚀