Momentum indicator⚡
Stochastic: What It Is and What It Is Used For in Trading🚪🦾
The stochastic indicator is an indispensable tool in technical analysis, used to measure the momentum and strength of price movements in financial assets such as stocks, currencies, commodities and cryptocurrencies. This oscillator aims to show where the current close is in the recent price range, helping to identify areas where the price could be overvalued or undervalued.
For novice traders, stochastics is a simple but powerful gateway to the world of technical trading. This article delves into everything you need to know to master it, from its basic concepts to practical applications. 🚀
What Is Stochastics?🎯
Stochastics is a momentum oscillator that measures the relationship between an asset's closing price and its price range over a given period. It was introduced by George Lane in the 1950s and is widely recognized for its ability to anticipate possible reversals before they become visible in price.
🔹The principle behind stochastics is simple:
In an uptrend, prices usually close near the highs of the range.
- In a downtrend, prices tend to close near the lows.
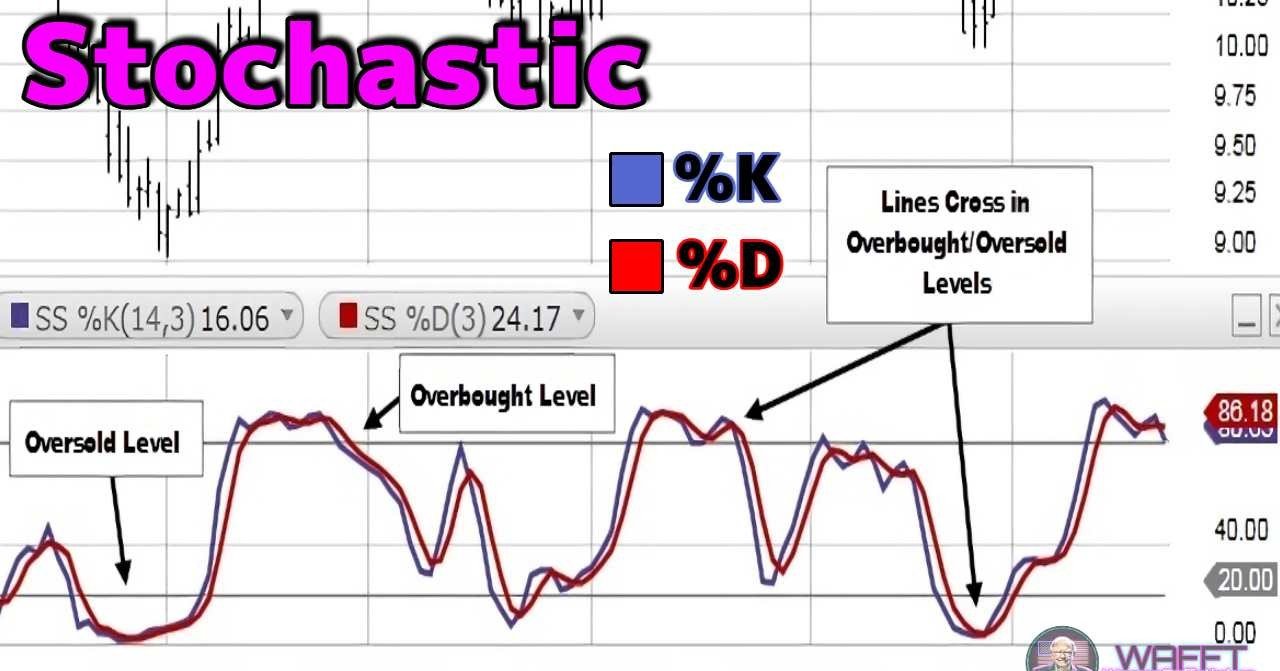
🔹Stochastic components:
%K (fast line): represents the current value of the stochastic and is calculated in real time. It is the main line of the indicator.
- %D (slow line): is a moving average of %K, used to smooth out fluctuations and generate clearer signals.
🔹Range of Values:
Stochastic ranges from 0 to 100, which makes it easier to interpret:
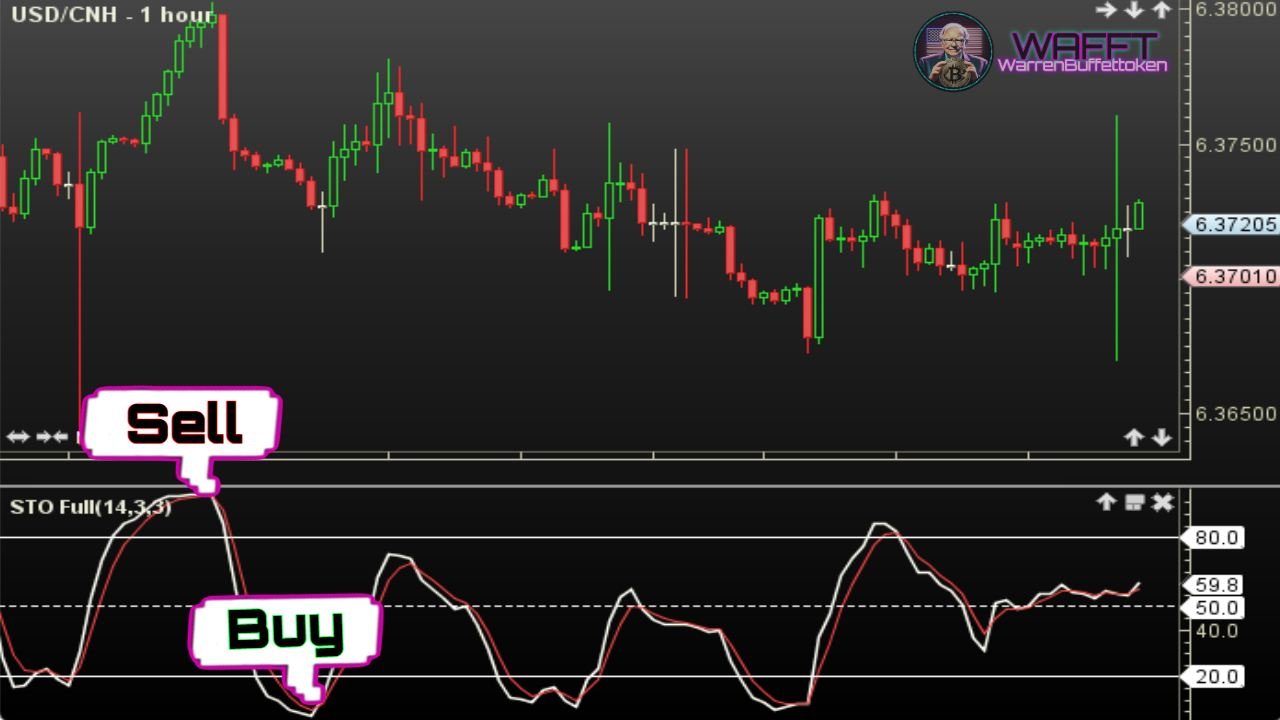
- Above 80: Overbought zone, where the asset could be overvalued and at risk of correcting.
- Below 20: Oversold zone, indicating that the asset could be undervalued and close to a rebound.
📌Bonus Fact:
You can adjust the stochastic periods according to your strategy. For example, a short period (14 days) is more sensitive and generates fast signals, while a longer period (50 days) produces smoother and more reliable signals. (▀̿̿Ĺ̯̿▀̿ ̿)
What is Stochastic used for?🔍

Stochastics has multiple applications in trading and is especially valuable for traders looking to identify key moments in the market.
1. Identifying Overbought and Oversold Levels
🔸Overbought (>80):
- When stochastic crosses above 80, it can be a sign that the price has risen too quickly and is overbought.
- This does not necessarily mean that the price will fall immediately, but it does mean that it is at a point where the odds of a correction are higher.
💡Practical example:
A stock that has risen 20% in a few days might show a stochastic at 90. This suggests that, although the uptrend is strong, buyers might start to pull back, triggering an adjustment.
🔸Oversold (<20):
When stochastic is below 20, it indicates that price may be at levels that are too low compared to its recent range.
This is usually an opportunity signal for a possible recovery.
💡Practical example:
an asset that has fallen continuously for weeks may show a stochastic at 15, suggesting that sellers are losing strength and the price could stabilize or move higher.
2. Detect Trend Reversals
Stochastics is ideal for identifying potential reversals before they become evident on the price chart. This makes it a key tool for traders looking to enter or exit the market at the right time.
🔹Reversal signals:
Crossing to the upside: When the %K line crosses upward across the %D line in the oversold zone, it indicates a possible reversal to an uptrend.
Downward crossover: when %K crosses downward %D in overbought zone, it may anticipate a downward correction.
💡Practical example:
If an asset shows a downtrend with stochastic at 10 and %K crosses upwards %D, it is a sign that sellers are losing control, and an uptrend could begin to form.
3 Confirm Existing Trends
In addition to identifying reversals, stochastics can also be used to confirm the strength of an existing trend.
In strong uptrends: If the stochastic stays above 80 for an extended period, it is a sign that buyers are dominating the market.
- In strong downtrends: If it remains below 20, it shows that sellers are exerting significant control.
📌Tip: Use stochastics in conjunction with other indicators such as RSI or moving averages for stronger confirmations.
Stochastic: How This Technical Indicator Works
The Stochastic Oscillator is a technical tool used by traders to identify potential reversal points in the market. Unlike other indicators, the stochastic focuses exclusively on the relationship between the closing price and its range over a specific period, providing clear overbought or oversold signals based on market dynamics.
How the Stochastic Oscillator Works🔢
Stochastic measures the relative position of the current closing price within its high-low range over a given period (by default, 14 periods). This translates into a percentage between 0 and 100.
Below, we explain how it works step by step:
1. High-low range identification:
The highest (maximum) and lowest (minimum) price in the selected period is calculated.
- This range acts as the “scale” on which the current closing price is measured.
2. Calculation of the stochastic percentage (%K):
The formula for %K is:
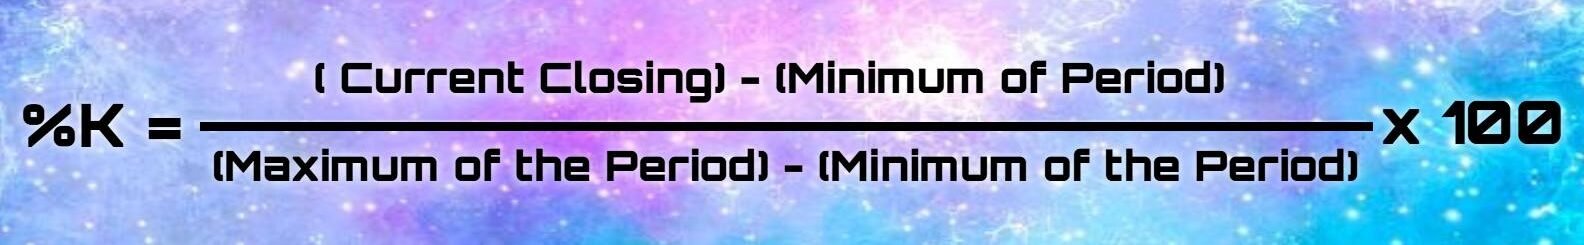
This value indicates where the closing price is in relation to the total range for the period.
3. The signal line (%D):
To smooth the fluctuations of the %K, a 3-period simple moving average (SMA), known as %D, is calculated.- This line functions as an additional reference to confirm the signals generated by the %K.
4. Signal interpretation:
Above 80: Indicates overbought; the price is near the upper end of the range and could correct soon.- Below 20: Indicates oversold; the price is near the lower end of the range and could bounce to the upside.
- Line crossings: when the %K crosses upwards the %D, it may be a buy signal; if it crosses it downwards, it may be a sell signal.
5. Divergences:
If the price continues to move up, but the stochastic starts to move down (or vice versa), this may indicate a possible trend reversal.
The stochastic oscillator is a powerful tool when thoroughly understood. By focusing on how it works rather than simply following its signals, you can more effectively integrate it into your trading decisions. 🚀
And you know, at WAFFT—the memecoin that bets on your financial education—we’re with you on this journey to get the best out of every indicator.
And pay attention, champ, because in the next section, you'll discover the most important types of stochastics so you can master each version like a true pro.
Don’t miss it!⚡️🔥
Stochastic Types📋
The Stochastic Oscillator not only measures momentum, but also allows you to identify buying or selling opportunities based on market behavior. Below, we explain the most common types and how to use them effectively, with relevant examples and details.
Thank you WAFFT! (๑˃̵ᴗ˂̵)ﻭ
1. Traditional Stochastic🟢
🔹What is it?
The Traditional Stochastic analyzes the closing price relative to its highest and lowest range over a specific time period, usually 14 days. It is ideal for detecting overbought (values above 80) and oversold (values below 20).
Easy to remember: If the price is near its recent high, the Stochastic will be high (overbought). If it is near the low, it will be low (oversold).
- It is like a market thermometer: if the price is “too hot” (above 80), it may be time to sell. If it is “frozen” (below 20), it may be time to buy. 🥶🔥
- Ideal for traders just starting out, because it helps you see when the market may be “overreacting” in one direction.
📌Fun Fact: This indicator was created by George Lane in the 1950s, and it's still super useful today!
🔹Advantages:
Fast and sensitive to changes in the market.
- Useful in sideways or ranging markets.
🔹Limitations:
May generate false signals in highly volatile markets.
- Requires additional confirmation to avoid erroneous entries.
💡Practical example:
You are analyzing Ripple (XRP) on a 1-hour chart.
1. The Traditional Stochastic rises above 80 as the price reaches a key resistance.
2. You wait for the indicator to fall below 80 as a signal of a possible correction.
3. You sell a portion of your XRP, locking in profits before a fall.
2. Slow Stochastic🔵
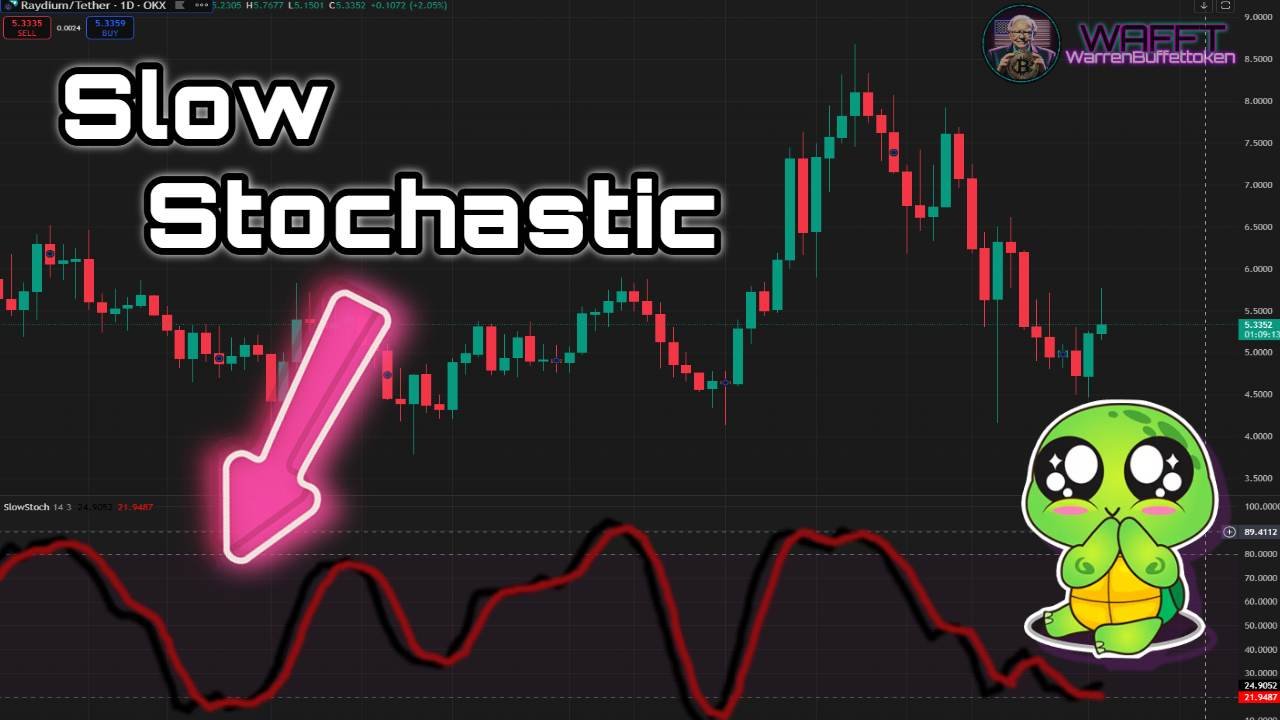
🔹What is it?
The Slow Stochastic is a “calmed down” version of the Traditional Stochastic, it smoothes the oscillations to avoid false signals caused by small market movements. It is less reactive, making it ideal for longer trends.
Think of it as a noise filter: while the Traditional Stochastic reacts quickly, the Slow Stochastic reacts more calmly, ideal for traders who want to avoid hasty entries.🎧- It is perfect for medium and long term trends, because it helps you focus on the most important price movements.
- If the Traditional is like a “fast spotter”, the Slow is like a sage who analyzes the situation more carefully.🧘♂️
📌Practical fact: It is very useful for markets with clear trends, such as cryptocurrencies in prolonged upward or downward movements.
🔹Advantages:
Filters out market noise.
More reliable in markets with clear trends.

🔹Limitations:
Can be slower to react to rapid changes.
- Less useful in narrow range markets. When I say “Less useful in narrow range markets”, I mean that the Stochastic indicator (especially Slow) may not be as effective when prices are trapped in a very small range, i.e. when the market has no significant up or down moves.
💡Practical example:
You are analyzing Solana (SOL) in a daily bull market.
1. The Slow Stochastic falls below 20, indicating oversold.
2. You wait for it to cross upwards and the price confirms support.
3. You buy SOL and hold your position as the market continues to rise.
3. Fast Stochastic⚡
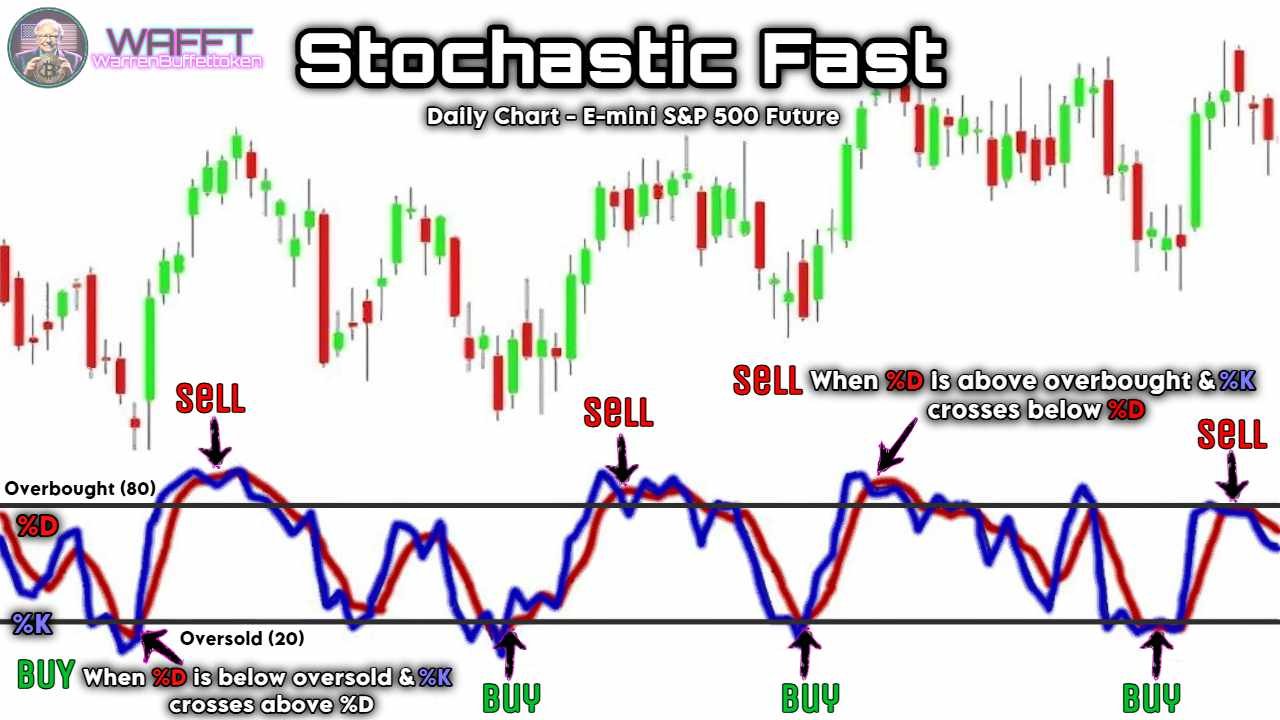
🔹What is it?
The Fast Stochastic is a more reactive version that measures momentum changes immediately. It is used primarily in high volatility markets for quick entry and exit signals.
Think of it as a sprinter: it always looks to get ahead of the curve and signal the smallest changes before they occur. 🏃♂️💨- However, beware! His sensitivity makes him prone to giving a lot of signals, some of which may be false.
- It's great for intraday traders or scalpers, as it offers quick opportunities to get in and out of the market.
📌Key Fact: It's like a short-range radar: it detects things very close, but doesn't always predict what's coming up ahead.
🔹Advantages:
Ideal for intraday traders or scalpers.
Detects momentum changes in real time.

🔹Limitations:
More prone to false signals due to its sensitivity.
- Requires experience to interpret correctly.
💡Practical example:
You are trading Dogecoin (DOGE) on a 15-minute chart.
1. The Stochastic Rapid rises above 80 and begins to turn down as the price reaches a resistance level.
2. You plan to sell quickly for profit.
3. Price corrects right after, confirming your strategy.
4. Full Stochastic🎯
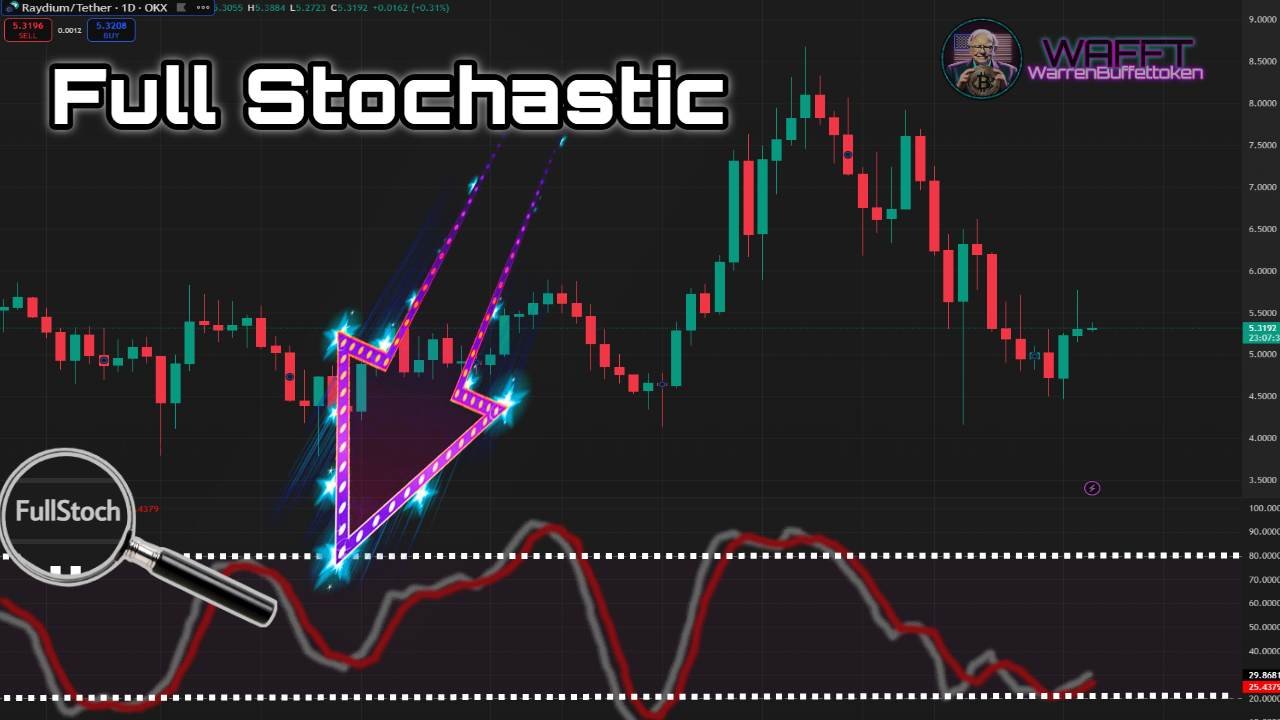
🔹What is it?
Full Stochastic is the most advanced and customizable version, it allows you to adjust both the period of the indicator and its smoothing. It is a flexible tool that adapts to different trading styles and market conditions.
It is like a multifunctional tool: it combines the speed of the Fast Stochastic and the calmness of the Slow Stochastic.🔧✨- You can set it to be super sensitive or more stable, depending on the asset you are analyzing and the timeframe you are using.
- Ideal for traders who are looking for precision and are willing to spend time optimizing their settings.
📌Advanced fact: Used extensively on assets that have unpredictable patterns, such as emerging cryptocurrencies or tech stocks.
🔹Advantages:
Customizable for different assets and time frames.
- Combines the best of Slow and Fast Stochastic.
🔹Limitations:
Requires testing to find the optimal settings.
- More complex for beginner traders.
💡Practical example:
You are watching Binance Coin (BNB) on a 4-hour chart.
1. You set the Full Stochastic to a 10-day period with a smoothing of 3 to better reflect the current trend.
2. The indicator crosses above 80 and then begins to turn downward, indicating a possible reversal.
3. You sell part of your position in BNB before the price begins to correct.
📌General Tips for Using Stochastics

1. Combine Indicators:
Use Stochastic along with support/resistance lines, moving averages or the RSI to confirm signals.
2. Avoid Volatile Markets:
In extremely volatile assets, stochastics can generate false signals; adjust parameters to reduce noise.
3. Watch Convergences/Divergences:
If the price goes up but the stochastic goes down (or vice versa), it may be a sign of an upcoming trend change.
4. Adjust Levels:
Instead of using 80/20 as standard, consider 90/10 in strong trending markets to avoid premature exits.
With these examples and details, you can start using Stochastic with confidence and improve your decision making as a trader. 🚀
Did you think only 'experts' or people with privileged connections could succeed in the world of investments? Well, at WAFFT, we’re here to prove you wrong!
We’re the platform that turns everyday people into top-level investors![]() , and we make it happen with our star guide: WAFFT: The Path to Wealth. With it, you break barriers, ditch the script set by the elites, and take full control of your finances—legitimately and powerfully.
, and we make it happen with our star guide: WAFFT: The Path to Wealth. With it, you break barriers, ditch the script set by the elites, and take full control of your finances—legitimately and powerfully.
Let’s go all in, champ! ⚡️🚀
Advantages of Stochastic✅

🎯Simple and straightforward:
Stochastic is super easy to use, even if you're just starting out in trading. It's based on a scale of 0 to 100 that shows whether an asset is overbought (above 80) or oversold (below 20). Perfect for spotting quick opportunities! 😊
🌐Works on any market:
Whether you trade stocks, cryptocurrencies, currencies, or commodities, Stochastic is useful for everyone. Plus, it works well on different time frames, from minutes to weeks. 🔀
⏳Spots market extremes:
Want to know when a price is overextended? Stochastic is your friend. When it's in the overbought or oversold zone, it's a sign that the price could turn around soon. 🚦
📉Great for sideways markets:
If the price is range bound (rising and falling within certain levels), this indicator shines. It helps you identify high and low points to buy low and sell high. 💸
🔍Identify divergences:
If the price is going up but the stochastic is going down (or vice versa), be alert! This can be an early sign of a trend change. It's like having an extra radar to spot opportunities. 🚨
⚙️Configurable for your style:
The standard stochastic uses 14 periods, but you can adjust it to suit your strategy, whether it's more conservative or aggressive. Flexibility at its best! 🔧
🤝Compatible with other indicators:
Use the stochastic together with moving averages, RSI or Bollinger Bands to confirm your analysis and reduce the risk of false signals. Teamwork! 🔗
👀Visually clear:
It has two main lines (%K and %D) that cross each other. When these lines cross at key zones (overbought or oversold), they give you clear signals to enter or exit the market. 📊
⚡Identify price momentum:
In addition to showing extreme points, the stochastic measures price speed. This helps you understand whether a trend is gaining or losing strength. 🏃♂️
🛠️Adaptable to trends and ranges:
Although it is great for sideways markets, it can also be useful in trends if you know how to read it. For example, look for bounces near 20 in an uptrend to keep buying. 📈
🎮Practical example:
If the stochastic is at 85+, the price could be close to a correction.
- If it's at 15 or below, the asset could be ready for an upward bounce.
✵But be careful! Always check with the market context and other indicators before acting. (。>﹏<)
WAFFT Conclusion🏁:
The Stochastic is like that friend who tells you when something is too cheap or too expensive. It's easy to use, versatile, and helps you plan entries and exits accurately. Just use it wisely and don't forget to combine it with other analysis. You control the strategy! 🌟
Stochastic Limitations❌
🚫False signals in strong trends:
The Stochastic can be overbought (80+) or oversold (20-) in a strongly trending market, but that doesn't mean the price is going to turn around anytime soon. Instead of going down, the price can keep going up (or down) for a long time. This can be confusing, especially for beginners.😵
⚠️Noise in volatile markets:
In highly volatile assets, such as cryptocurrencies, the Stochastic can generate a lot of conflicting signals. One minute it says buy, the next, sell! This can make you lose clarity in your analysis.🌪️
⏳Lagging indicator:
Although the Stochastic measures momentum, its signals are dependent on past data. This means that it is sometimes late to identify key moves or important breakouts.🕒
❌It doesn't distinguish well between ranges and trends:
The Stochastic works great in sideways (ranging) markets, but in trending markets, it can give wrong signals. If you try to sell in an uptrend just because the indicator shows overbought, you might get out too early.📉
🔍Problems with divergences:
Divergences between price and Stochastic don't always mean a trend change. Sometimes, these signals can be false, especially in noisy markets.🤔
⚙️Setting dependency:
If you don't set the periods (%K and %D) correctly, you can get unreliable signals. A standard setting (14, 3, 3) doesn't always work for all assets or time frames.🛠️
📉It doesn't measure trend strength:
The Stochastic doesn't tell you how strong a trend is. If you are looking to trade in clear directions, you will need to complement it with other indicators that measure the strength of the movement, such as the ADX.📊
🔗Needs confirmation:
On its own, Stochastic is not enough. You must use it in combination with other indicators or tools (such as support and resistance) to get more reliable signals and avoid mistakes.🤝
🌐Less effective on some assets:
In markets with very fast or sudden movements, such as commodities or certain stocks, Stochastic can lag behind or generate inaccurate signals.⚡
🎮Practical example of limitation:
You are trading Bitcoin in a strong uptrend. Stochastic is overbought (85), you decide to sell thinking that the price will go down. But, instead of correcting, the price keeps going up and you miss part of the movement.😓
WAFFT Conclusion🏁:
Stochastic is a powerful tool, but it is not infallible. While it helps you identify key points in the market, it is important not to blindly trust its signals. Combine it with other analysis, consider the market context and adjust the parameters according to your strategy. The key is balance! ⚖️
Strategies for Using Stochastic: The Ultimate Guide for New Investors🛠️
The Stochastic Oscillator is an amazing tool for spotting buying and selling opportunities. It's easy to understand, super useful, and perfect for those who want to get the most out of technical analysis without the hassle.
Here's everything you need to know to use it like a pro! 🚀
🎯Quick review: What is the Stochastic Oscillator?
The Stochastic measures the relationship between an asset's closing price and its price range over a defined period of time. It moves between 0 and 100 and helps us identify whether an asset is overbought or oversold.
Overbought Zone (80+): The price could go down soon.
- Oversold Zone (20-): The price could bounce back up.
💡Fun fact:
It's made up of two lines: %K (fast) and %D (slow). When these lines cross, it's time to pay attention!
📈Basic Strategy: Overbought and Oversold
Ideal for beginners, this strategy uses the key zones of the Stochastic.
🔹How to apply it?
1. Buy: When the Stochastic falls below 20 and then starts to rise. 🟢
2. Sell: When the Stochastic rises above 80 and then starts to fall. 🔴
💡Practical example:
You look at the Tesla chart and notice that the Stochastic is at 15 (oversold zone).
- The stock price drops to $180, but the Stochastic starts to rise and crosses 20 upwards. You decide to buy.
- The price quickly rises to $200, and the Stochastic reaches 85 (overbought). So, you sell to secure your profit.
- Result: You bought at $180 and sold at $200, securing $20 per share.
🔄Line Crossovers: Powerful Signals
When the %K and %D lines cross, they can mark important market turns.
🔹How to apply it?
1. Buy: When %K crosses upwards to %D in the oversold zone (below 20).
2. Sell: When %K crosses downwards to %D in the overbought zone (above 80).
💡Practical example:
On the EUR/USD chart, %K crosses upwards to %D while the Stochastic is at 18.
- This happens as the price of the pair falls to 1.0500, but begins to stabilize. You take a long position (buy).
- Later, the Stochastic rises to 83, and %K crosses downwards to %D. You decide to close your position.
- Result: You bought at 1.0500 and sold at 1.0650, making a profit of 150 pips.
If you don't know what a pip is, WAFFT will explain it to you:
What is a pip and how to calculate it:
Definition:
- In currency pairs with four decimal places (for example, EUR/USD = 1.1050), a pip is the change in the fourth decimal place.
- Example: If EUR/USD goes from 1.1050 to 1.1060, the difference is 10 pips.
- Example: If EUR/USD goes from 1.1050 to 1.1060, the difference is 10 pips.
- For pairs with two decimal places (such as USD/JPY = 145.60), a pip is the change in the second decimal place.
- Example: If USD/JPY goes from 145.60 to 145.70, the difference is 10 pips.
🧭Divergences: Spot Hidden Trend Changes
Divergences are advanced signals that detect reversals before they happen.
🔹How to identify them?
1. Bullish Divergence: Price makes lower lows, but Stochastic makes higher lows.
2. Bearish Divergence: Price makes higher highs, but Stochastic makes lower highs.
💡Practical example:
On the Bitcoin chart, the price drops from $60,000 to $59,000, but Stochastic makes higher lows (from 10 to 25).
- This suggests that the bearish momentum is losing strength. You take a long position (buy) at $59,000.
- The price spikes to $61,000, confirming the reversal.
- Result: You bought at $59,000 and sold at $61,000, making $2,000 profit per share.
⏳Slow Stochastic vs. Fast Stochastic: Adjust Your Style
Fast Stochastic: More sensitive to price movements, ideal for intraday traders.
- Slow Stochastic: Filters out market "noise," better for swing traders.
💡Practical example:
You analyze the daily chart of Amazon with a Slow Stochastic. You see that it is at 22 (oversold zone).
- This gives you time to plan a smooth entry. You buy at $120.
- The Stochastic slowly rises to 80, and you decide to sell at $140.
- Result: A profit of $20 per share with less stress.
📌Tip: If you are an intraday trader, use the Fast Stochastic. For swing trading or long-term positions, the slow one is more reliable.
🧩Stochastic + Other Indicators Combination
Stochastic improves when you combine it with tools like RSI or Bollinger Bands.
🔹Stochastic + RSI:
Buy when Stochastic is oversold (<20) and RSI near 30.
- Sell when Stochastic is overbought (>80) and RSI near 70.

💡Detailed example:
On an Apple chart, Stochastic falls to 18 and RSI to 28. Both start to rise, indicating a possible reversal.
- You buy at $150 and sell at $170 when both indicators reach their opposite levels.
- Result: You made $20 per share with double confirmation.
🔹Stochastic + Bollinger Bands:
- Buy when Stochastic is oversold and price touches the lower band.
- Sell when Stochastic is overbought and price touches the upper band.

💡Practical example:
On a Microsoft chart, price falls to $300 and touches the lower band, while Stochastic is at 18. You buy.
- Price rises to $320, touches the upper band, and Stochastic reaches 85. You sell.
- Result: $20 profit per share.
⚡Extra Tips for Using Stochastic Successfully:
1. Avoid using it in markets without a trend: In sideways markets, it can give false signals.
2. Try custom settings: Although the standard is 14 periods, experiment with 9 or 21 depending on your strategy. 🕒
3. Use it as confirmation: Combine it with supports, resistances, and candlestick patterns.
4. Practice before investing: Use these strategies in a demo account before risking real money. 🎮
The Stochastic Oscillator is your perfect ally to find key entry and exit points. With these strategies and practical examples, you are ready to get the most out of it. Start using it and take your investments to the next level! 🚀
Key differences between Stochastic and RSI👯♂️

At WAFFTacademy📖, we want you to become a true investment pro, mastering every indicator and tool like an expert. That’s why we’ve prepared this special section: the RSI and the Stochastic may look almost like twins on the chart, but don’t be fooled. They are very different in both calculation and usage.
Although the Stochastic and RSI are distinct tools in terms of formula and application, they share visual similarities that can throw you off. Here, I’ll break it down clearly so you can master both indicators without overcomplicating things.
With this knowledge, you’ll be one step closer to the financial independence that WAFFT: The Path to Wealth promises.
Let’s go for it! 🌀✨
1. where do they appear on the chart?🖼️
- Both usually live underneath the main price chart, in their own “apartment.”🏢
- You'll usually find them in separate windows or tabs, one on top of the other. No fighting for space, guys!😅
2. The scale: 0 to 100📏
Both the RSI and Stochastic are on a scale of 0 to 100.
The overbought and oversold levels are also different:
RSI: 70 (overbought) and 30 (oversold).
Stochastic: 80 (overbought) and 20 (oversold).
👉This is where you should start paying attention!🧐
3. The lines: one or two?🤔
RSI: It only has one lonely line that rises and falls gently, like a calm river.🌊
- Stochastic: More dramatic, it shows you two lines (%K and %D), which seem to have a constant conversation (and sometimes an argument). 🗣️⚡
4. Movements: Calm vs. hyperactive🐢vs.🐇
RSI is calmer, smoother and more fluid. Think of it as the zen friend of the group.🧘♂️
- Stochastic is the opposite: more reactive, with quick rises and falls, like someone who had too much coffee.☕⚡
Summary in a nutshell📝
- RSI: Smooth moves, single line, perfect for those seeking calm in the chaos of the market.
- Stochastic: Fast movements, two lines, ideal for those who love adrenaline and more frequent details. 🚀
That's it!!! Now, the next time you see these indicators, you'll know who's who and why one is the calm and the other the hyperactive of the
momentum indicator family.⚡️✨
Stochastic: The Final Close⚿
The Stochastic is like a radar to detect when the market is accelerating or slowing down, helping you identify key overbought and oversold areas. It is especially useful in sideways markets, where other indicators can fail, but it can also give you clues in trends when combined with other tools.![]()
👍One of its greatest advantages is its simplicity and versatility. With its two lines (%K and %D), you can detect crossovers that usually indicate possible changes in direction. In addition, adjusting its settings allows you to adapt it to different trading styles, whether intraday, swing or even long-term.🕒
👎Of course, it is not perfect. In markets with strong trends, the Stochastic can stay at extreme levels for a long time, and if you do not use it correctly, you could act prematurely. Therefore, combining it with support and resistance analysis, or with indicators such as the RSI or MACD, can give you a more complete view. 🤝
Remember, the real key isn’t just interpreting the Stochastic—it’s understanding it within the market context. Practice, analyze your mistakes, and adjust your strategy based on your results. 🎯
And that’s a wrap for this section on the Stochastic, champ! But don’t go just yet—below, you’ll find all our social media links to join the WAFFT community. Connect with us, share your questions, and keep growing as an investor alongside us.
We’re waiting for you! ٩(♡ε♡ )۶✨