Momentum indicator⚡
RSI: The Opportunity Detector to Boost Your Investments📡🫂
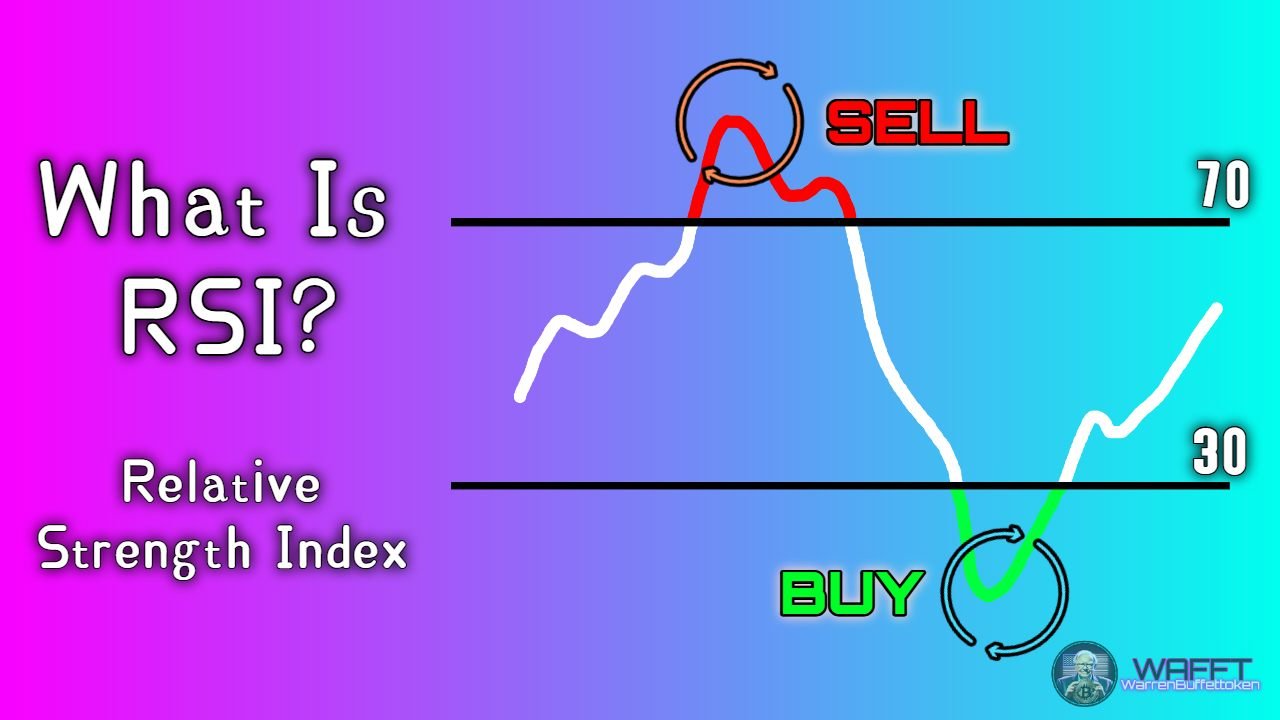
The Relative Strength Index (RSI) is one of the most widely used indicators in technical analysis. This momentum oscillator measures the speed and change of price movements, helping traders identify overbought or oversold conditions in the market. Whether you're a beginner or an expert, understanding the RSI can improve your trading decisions. 🚀
What is RSI and how is it calculated?🔢
Think of the RSI as a thermometer that measures the mood of the market, indicating when prices might be too high (overbought) or too low (oversold). Here's how it works:
1. The RSI formula:
The RSI is calculated using a formula that compares the average of recent highs to the average of recent lows over a given period (usually 14 days). The result is a value ranging from 0 to 100.
2. Interpretation of RSI values:
Above 70: The asset could be overbought, which means that its price has risen a lot and could correct soon.- Below 30: The asset could be oversold, indicating that its price has fallen too much and could bounce upwards.
3. RSI usage:
Trend confirmation: The RSI can help you confirm whether a trend is strong or losing strength.- Entry and exit signals: When the RSI crosses certain key levels (such as 30 or 70), it can give clues about possible entry or exit points.
- Divergences: If the price goes up, but the RSI goes down (or vice versa), it can be a sign that the current trend is weakening.
With this tool, you can spot opportunities in the market and make informed decisions. Together with WAFFT, you'll take your investment strategy to the next level.
Mastering the RSI can completely change the game in your trading! 🔥
⬇️Continue in this section to uncover all the secrets and intricacies that will turn you into a true RSI sensei. ![]()
( ͡ಥ‿ ಥ)━☆゚.*・。゚
How does RSI work?🤔

The RSI, or Relative Strength Index, is a super popular tool in technical analysis that helps you identify whether an asset is overbought (👆 too expensive) or oversold (👇 too cheap). It's like a market emotion detector! 😄
🧮How is it calculated?
RSI moves on a scale from 0 to 100 and is calculated using average gains and losses over a period of time, usually 14 days. Here goes the basic breakdown:
1. Calculates average gains during days when the price rose.
2. Calculate the average losses during the days when the price went down.
3. Use this magic formula to get the RSI:

Where RS is the ratio of average gains to average losses.
💡Understanding with a simple example
Imagine you sell pizzas for 14 days. 🍕 Some days you have good sales (profits) and others not so good (losses):
- Profit days: 10, 12, 14, 9 (total: 45).
- Losing days: 8, 7, 6, 9 (total: 30).
1. Calculate the average profit and loss:
Average Profit:

- Average losses:

2. Get the RS:

3. Substitute in the RSI formula:
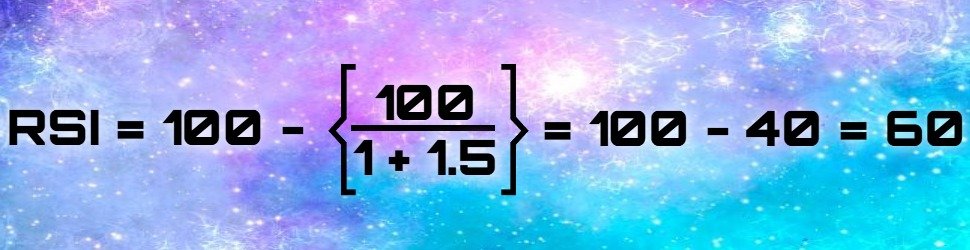
So your RSI is 60. This indicates that the market is balanced, but if it were to rise to 70 or higher, watch out! You could be in an overbought zone. If it goes down to 30 or below, maybe it's a bargain (oversold zone). 🤑
🐝Why is it useful?
🔹RSI is a great ally because:
- It alerts you when the market might be overreacting (overbought or oversold).
- It complements other tools (e.g., moving averages, support/resistance) to confirm or discard signals.
- It’s visually intuitive: a simple line oscillating between 0 and 100, making it easy to spot potential turning points.
- It can signal divergences (when price moves in one direction and RSI moves in another), which often hint at an upcoming market reversal.
📌Extra Tips:
The standard RSI period is 14, but you can tweak it (shorter periods = more signals, but also more noise).- Many traders watch the 70/30 zones for overbought/oversold conditions, though some tighten them to 80/20 in very volatile markets.
🔹 Remember, fellow trader:
RSI is not a crystal ball 🔮. Think of it as a clue, not an absolute truth.
The real magic happens when you combine RSI with other indicators and always keep an eye on broader market trends. 🪄
And that’s it! Now you understand how to use RSI like a pro. But don’t stop here—there’s so much more out there if you want to aim for that top Wall Street investor level (and we’re not kidding). 🤫🚀
What is RSI for?🎯
The Relative Strength Index (RSI) is like a thermometer for the market's momentum![]() : it helps you measure the strength and speed of price movements, giving you clarity in decision-making. 🌟 Here's how it can be used:
: it helps you measure the strength and speed of price movements, giving you clarity in decision-making. 🌟 Here's how it can be used:
🔍Identifying Overbought and Oversold Levels
The RSI is ideal for detecting when an asset might be overvalued (overbought) or undervalued (oversold):
- If the RSI is above 70, the market may be overbought, indicating a potential reversal or correction. 📉
- When it drops below 30, the market could be oversold, signaling a possible rebound. 📈
🚦Generating Buy and Sell Signals
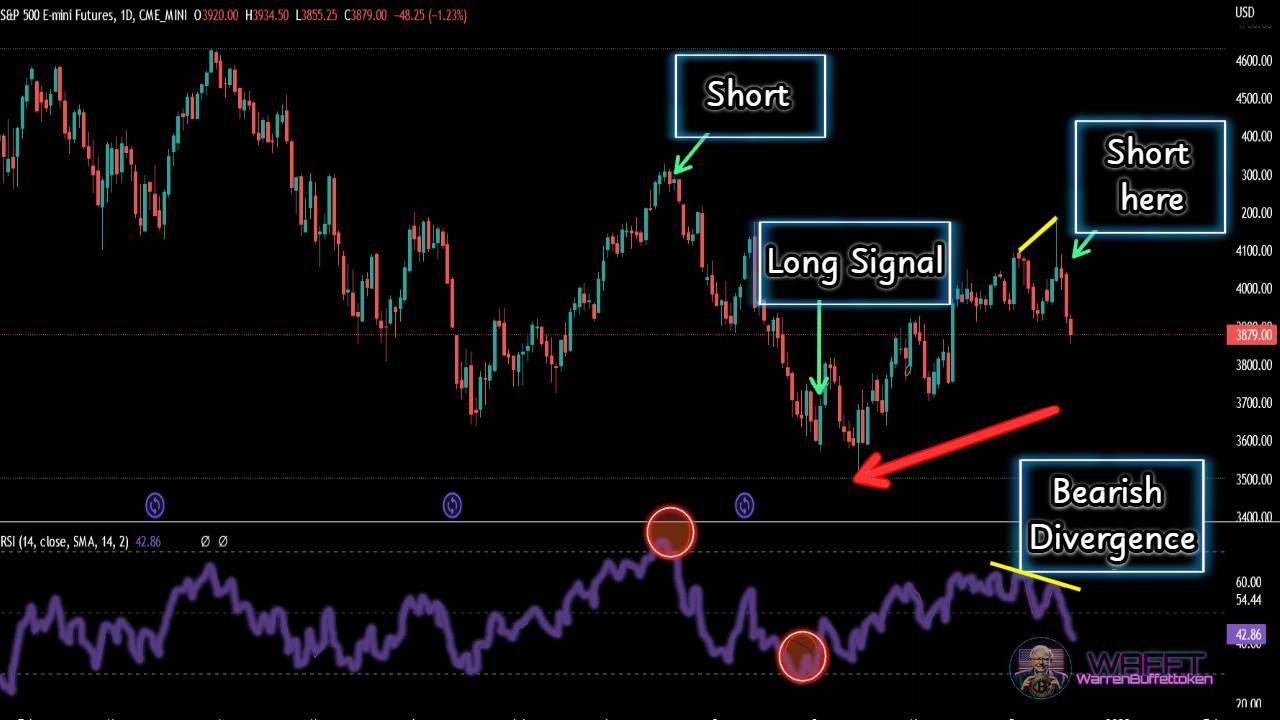
The RSI can provide clear action signals based on divergences and crossovers:
- Bullish Divergence: When the price is making lower lows, but the RSI forms higher lows, it suggests a potential trend reversal upwards. 🛒
- Bearish Divergence: If the price makes higher highs while the RSI declines, it may indicate a potential downturn. 💼
📏Confirming Trends
RSI is also useful for trend confirmation:
- In a strong uptrend, the RSI often stays above 50.
- During a downtrend, it typically remains below 50.
This can help you stay aligned with the prevailing market direction and avoid premature exits.
🔄Filtering Market Noise
The RSI smooths out market noise and focuses on meaningful momentum shifts. 🤝 By using it alongside price action, you can make more informed decisions and avoid being swayed by short-term volatility.
📌Bottom line:
The RSI is an essential tool for any investor looking to make better market decisions. It helps you detect pullbacks and confirm trends, adding a layer of precision to your strategy and giving you the confidence to navigate the markets successfully.
In the WAFFTguide: The Path to Wealth, we present the key pillars to maximize indicators like the RSI and boost your financial growth.🏛️
Ready to level up? In the next section, we'll explore the different types of RSI, discovering which ones best fit your investment style. You won’t want to miss it! 🫨🚀
Types of RSI📋
The RSI (Relative Strength Index) is a powerhouse indicator in technical analysis, used to measure the speed and change of price movements. But, did you know there are multiple ways to tweak the RSI for different trading styles? Whether you're hunting for reversals, confirming trends, or spotting hidden opportunities, there's an RSI type tailored just for you.
Here, in true WAFFT style, we break down the most important types of RSI. Let’s dive into the details while keeping it fun and simple—just like the spirit of the WAFFT memecoin community!🚀👨🏻🦳
1. Classic RSI (The fundamental yet unstoppable one)🟢
🔹Advantages:
Easy to understand and implement, even for beginners.
- It allows to quickly identify overbought and oversold levels, helping to avoid impulsive decisions.
- It is versatile and adapts to any time frame, from intraday charts to long-term analysis.
🔹Limitations:
May generate false signals in sideways or highly volatile markets.
- It does not consider sudden changes in momentum, which sometimes makes it less reactive in fast market situations.
🔹Strategies:
Combine it with support and resistance lines to validate signals.
- Use divergences: when price and RSI move in opposite directions, it may indicate a trend change.
💡Practical example:
Imagine you are analyzing Bitcoin (BTC) on a 4-hour chart. The RSI shows a value of 80, which indicates overbought.
🔹What can you do?
Step 1: Wait for the RSI to drop below 70; this may be a sign that the price will start to fall.- Step 2: Plan to sell a portion of your Bitcoins if the RSI confirms the decline, especially if you also notice red candles on the chart.
- Expected result: You avoid getting caught in a price drop and secure your profits.
2. modified RSI🔵
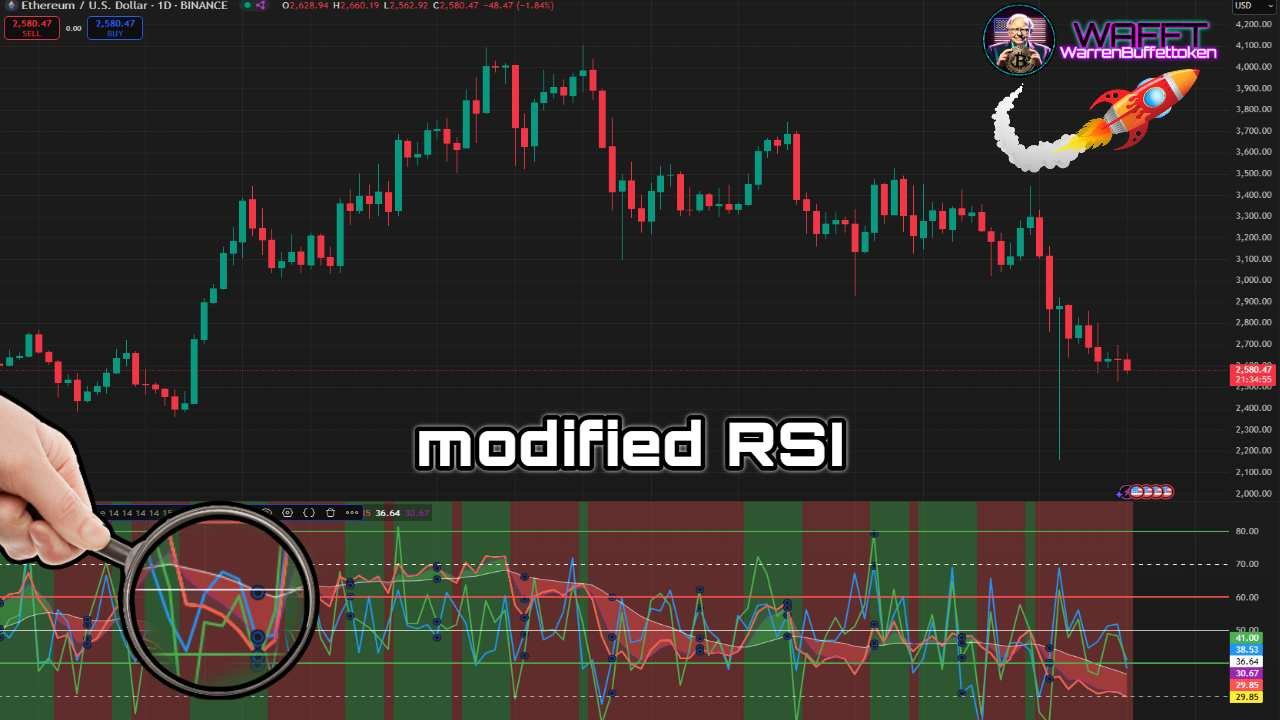
🔹Advantages:
Adjusting the calculation period makes it more flexible for different trading styles.
- Shorter periods (7 days) are ideal for scalping and intraday trading.
- Longer periods (21 days or more) are useful for long-term trends.
- Reduces false signals in specific markets by customizing to asset conditions.
🔹Limitations:
If adjusted too much to be faster, it can become too sensitive, generating conflicting signals.
- Requires trial and error to find the optimal period based on the market being analyzed.
🔹Strategies:
- Adjust the RSI period according to the volatility of the asset (shorter for volatile assets, longer for stable markets).
- Combine it with indicators such as MACD or moving averages for signal confirmation.
💡Practical example:
You are doing intraday trading with Ethereum (ETH) and you adjust the RSI to a 7-day period instead of 14 to make it faster. You see that the RSI rises above 70 and then quickly drops to 50.
🔹What can you do?
Step 1: Interpret the rapid change in the RSI as reflecting a volatile move.
- Step 2: Plan to buy if the RSI stabilizes near 50 and the price shows support on the chart.
- Expected result: You take advantage of a small pullback and enter a position just before the price rises again.
3. RSI Stochastic⚖️
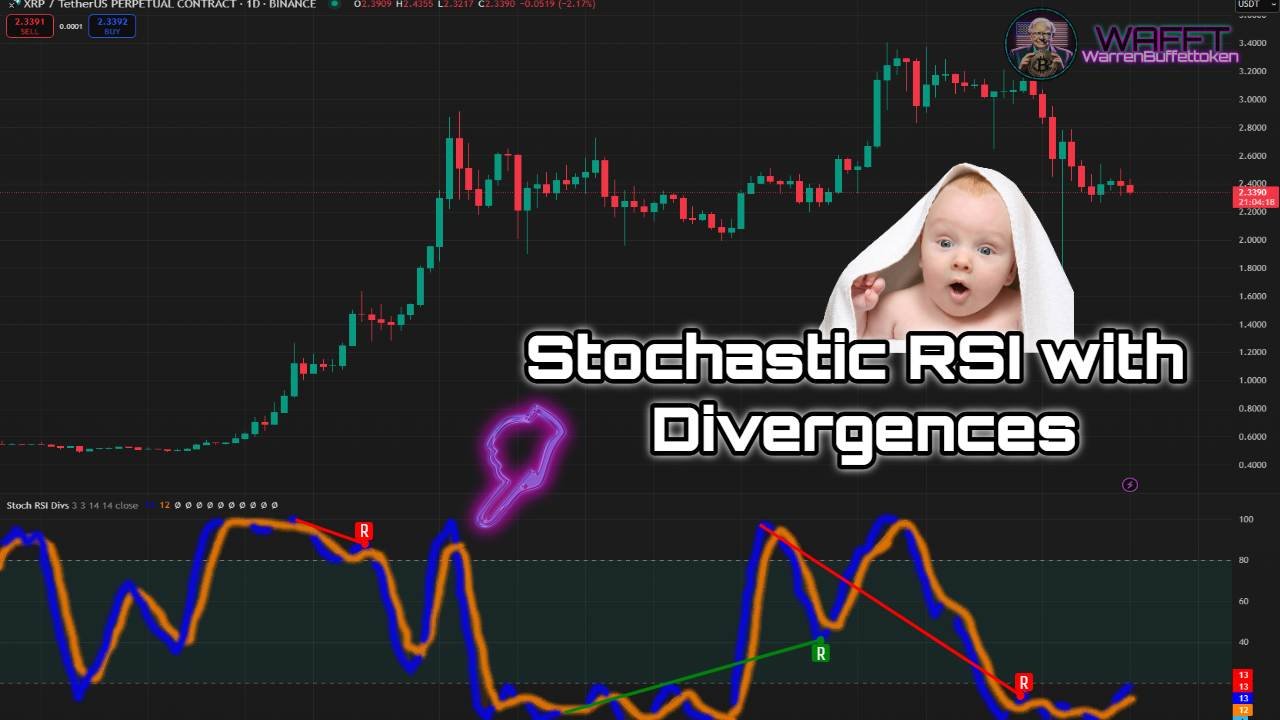
🔹Advantages:
Provides a more accurate perspective because it combines two indicators.
- Reduces the possibility of misinterpreting overbought or oversold levels.
- Works well in volatile markets by incorporating the recent price range.
🔹Limitations:
More complex to calculate and understand than traditional RSI.
- May give delayed signals if the market has very sharp movements.
🔹Strategies:
Use extreme values of the stochastic RSI (above 80 or below 20) to identify critical reversal points.
- Look for convergences or divergences between the stochastic RSI and the asset price.
💡Practical example:
You are watching Cardano (ADA) in a sideways market (price moves up and down in a small range). The stochastic RSI shows a value of 85 (relative overbought) while the price touches the top of the range.
🔹What can you do?
Step 1: Interpret both the stochastic RSI and price as indicating a possible pullback.
- Step 2: Plan to open a short position (sell) when the stochastic RSI starts to decline and the price rejects resistance.
- Expected result: You make quick profits in markets that do not have a clear trend.
4. Dynamic RSI 🧠

🔹Advantages:
It is adaptive and better reflects real-time market conditions.- It reacts faster in volatile markets, providing useful signals at critical times.
- It is ideal for assets such as cryptocurrencies or Forex, where fast movements are common.
🔹Limitations:
It is more complex to implement due to its advanced formula.- It can be difficult to interpret for less experienced traders.
🔹Strategies:
Combine dynamic RSI with Bollinger bands to identify key entry and exit zones.- Use in conjunction with volume analysis to confirm signals at times of high volatility.
💡Practical example:
You are following Solana (SOL) during a major release that causes high volatility. The dynamic RSI automatically adjusts its sensitivity and begins to rise rapidly as the price shoots up.
🔹What can you do?
Step 1: Watch how the dynamic RSI follows the price movement. If it rises above 80 but the price is still strong, you can hold your position.- Step 2: If the RSI starts to fall while the price is also showing weakness, consider exiting your position.
- Expected result: You maximize profits by following the movement and reduce losses by exiting at the right time.
📌General Tips for Using the RSI
1. Avoid Using It In Isolation: The RSI is most effective when combined with other indicators such as moving averages, MACD or volume analysis.
2. Analyze Market Context: In sideways markets, the RSI is more reliable for identifying overbought and oversold; in trending markets, it may be better for identifying continuation points.
3. Divergences: A divergence between price and RSI (e.g., price goes up, but RSI goes down) can be a warning sign of a trend change.
4. Adjust Overbought/Oversold Levels: In specific markets, it is useful to adjust levels from 70/30 to 80/20 to reduce false signals.
With this detailed information, you can take better advantage of the different RSI variants and customize your analysis according to your trading strategy. 🎯
Advantages of RSI✅

🔥Simplicity:
The RSI (Relative Strength Index) is easy to understand and apply, even for trading beginners. With a value range between 0 and 100, you simply need to identify whether it is in an overbought or oversold zone to find potential opportunities. 😊
🌐Versatility:
RSI adapts to a wide variety of markets, such as stocks, currencies, commodities and cryptocurrencies. It is useful regardless of the type of asset you trade. 🌍
⏳Market extremes detection:
It is especially effective in identifying times when an asset is overbought (above 70) or oversold (below 30), which can indicate potential reversal points. 🔄
📉Trend confirmation:
Helps confirm whether a trend is strong or losing momentum. For example, when the RSI stays above 50 in an uptrend, it indicates strength; below 50, it signals weakness. 📈
🔍Identification of divergences:
The RSI can show divergences between the price and the indicator, which often signals impending trend changes. For example, if the price goes up but the RSI goes down, it could be anticipating a correction. 🤔
⚙️Adjustable to different strategies:
Allows you to customize your settings (e.g. 14 periods) to suit different trading styles, whether short, medium or long term. 🕒
🔗Compatible with other indicators:
Works well in conjunction with tools such as Bollinger Bands, MACD or moving averages, providing more reliable signals. 🤝
👁️Clear visual indicator:
The RSI chart is easy to interpret and provides a clear representation of market behavior, making it easy to identify key entry and exit zones. 🖼️
⚖️Relative strength analysis between assets:
In addition to measuring the strength of an individual asset, the RSI can be used to compare the relative strength of different assets, helping you choose the best opportunities. 🔄
🎮Practical example:
Bitcoin: RSI = 65 (strong but close to overbought).
- Ethereum: RSI = 40 (weaker but with room to move higher).
✵In this case, if you're looking to buy, Ethereum might be a better choice because it has more potential to move up from its level.
The RSI is a valuable tool for both beginner and advanced traders. Not only is it simple to use, but it also allows you to identify key levels, divergences and market momentum accurately. 🌟
Limitations of RSI❌

🚫Lack of market context:
The RSI (Relative Strength Index or Relative Strength Index) can indicate overbought or oversold, but it does not always mean that the price will change direction. In strong trends, the RSI can remain at extreme levels (above 70 or below 30) for a long time, which can confuse traders.
⚙️Sensitivity to the setting:
The standard RSI setting is 14 periods, but this does not always fit all assets or time frames. If you don't customize the number of periods correctly, you could receive unreliable or delayed signals.
⏳Lagging indicator:
Although the RSI is an oscillator, it is still an indicator that bases its calculation on past data. This means that its signals may be late, especially on sharp market movements.
❌It does not directly identify trends:
The RSI does not distinguish between a ranging (sideways) market and a trending market. In a market with no clear direction, its overbought or oversold signals are usually more accurate, but in strongly trending markets, it can generate false signals.
⚠️False divergences:
Although divergences between price and RSI are useful, they do not always result in a trend change. Sometimes these signals can be false, especially in volatile or manipulated markets.
🔗Dependence on other indicators:
RSI alone does not provide a complete picture of the market. For more reliable signals, it should be combined with other indicators such as MACD, moving averages or volume analysis.
📉Inability to predict large moves:
The RSI cannot predict major breaks of support or resistance. If an asset is building up strength for a large move, the RSI may not detect it in time.
🌐Less effective on some assets:
In highly volatile markets, such as cryptocurrencies, RSI can generate conflicting signals due to extreme price movements.
🎮Practical example of limitation:
If you trade in a market with a strong uptrend and the RSI marks overbought (70+), you might sell prematurely thinking that the price will go down. However, in a strong trend, the price could continue to rise for days or weeks, causing you to miss a good opportunity.
WAFFT Conclusion:
The RSI is a useful tool, but it is not perfect. It should be used in conjunction with other analysis and always considering the market context. It's not just about blindly trusting the indicator's signals, but using it as one more piece within your strategy. 💡
Strategies for Using the RSI (Relative Strength Index):🛠️

The RSI is a must-have tool for technical analysis! It is simple, powerful and easy to use, perfect for those who are just starting to invest.
Here we leave you with practical strategies to keep you creating the expert investor you are destined to be. 🚀
☄️Quick review: What is the RSI and how does it work?
The RSI measures the strength and speed of price movements on a scale from 0 to 100. Its main purpose is to identify whether an asset is overbought (went too high) or oversold (fell too low).
Overbought zone (RSI > 70): The price could go down soon.
- Oversold zone (RSI < 30): Price could go up soon.
💡Quick tip:
Between 30 and 70 is “neutral zone”, where the market is more balanced.
🔄Basic Strategy: Overbought and Oversold
This is the easiest and most effective strategy for using RSI.
🔹How to apply it?
1. Buy: When the RSI goes below 30 and starts to rise, it may be a sign of a bullish bounce. 🟢
2. Sell: When the RSI rises above 70 and starts to fall, a bearish pullback may be coming. 🔴
💡Practical example:
🔀Divergences: Detect Hidden Changes in the Market
Divergences between price and RSI are powerful clues to a possible trend change.
🔹How to identify them?
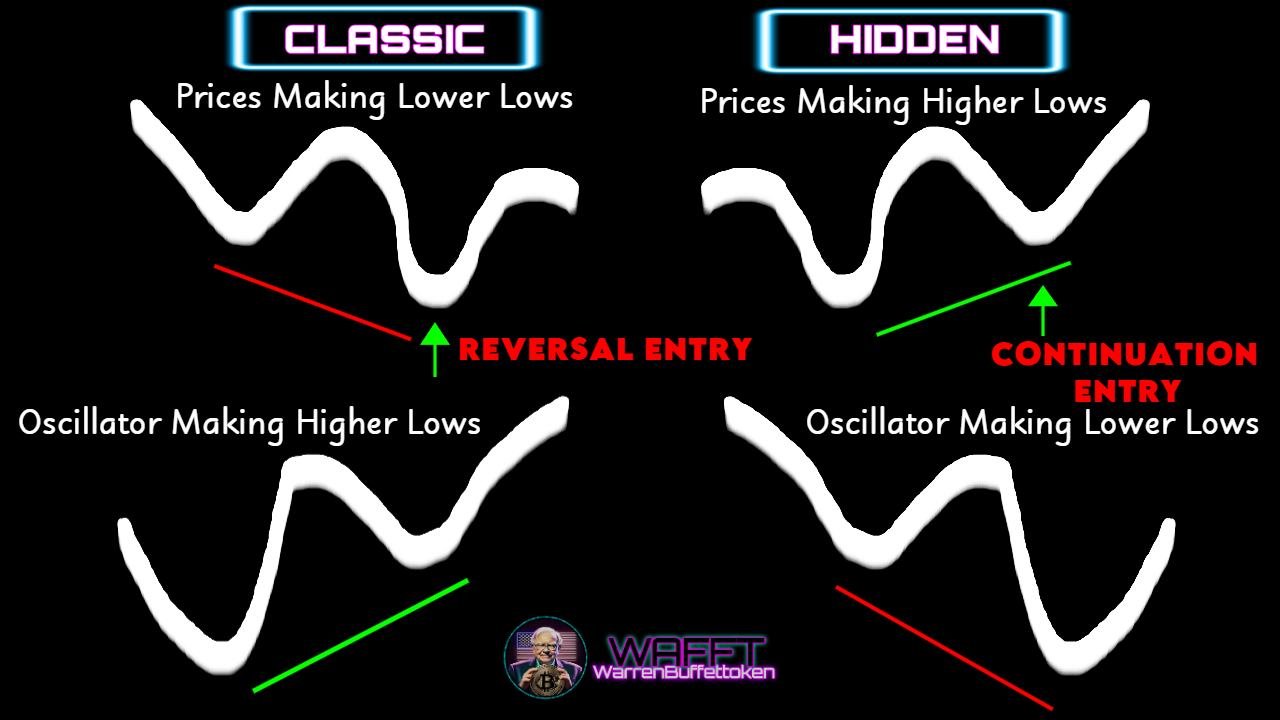
1. Bullish Divergence: Price makes lower lows, but the RSI makes higher lows. Sign that the price could move higher soon. 🟢
2. Bearish Divergence:Price makes higher highs, but RSI makes lower highs. Indicates that the price could go lower. 🔴
💡Practical example:
- On the Bitcoin chart, the price goes down, but the RSI starts to go up.
- You take the opportunity to buy in anticipation of the price rise. 🎯
⏳Long-Term Strategy: RSI on Weekly Charts
Ideal for those looking to trade without worrying about daily swings.
🔹How to apply it?
1. Buy when the RSI is near 30 on a weekly chart.
2. Sell when the RSI is above 70.

💡Practical example:
- You analyze the S&P 500 and see that the RSI is at 28 on the weekly chart.
- You buy and hold the position until the RSI rises to 75, locking in profits. 💼
🧩RSI + Other Indicators Combination: The Winning Formula
RSI works even better when you combine it with other indicators.
🔹Example: RSI + Moving Average (MA)
1. Buy only if the RSI is rising from 30 and the price crosses the moving average to the upside. 📈
2. Sell if the RSI is down from 70 and the price crosses down the moving average.
💡Practical example:
On the Tesla chart, the RSI rises from 30 and the price crosses above its 50-day moving average.
You buy and hold the position until both signals change.
The RSI is your ally to detect entry and exit points in the market. 🛠️ Learn these strategies, apply them with confidence and take your investments to the next level - success guaranteed! 🚀
How to use the RSI in a trade: A practical example ₿

Imagine you are analyzing the Bitcoin market because you are looking for a good buying opportunity. You know that the RSI is a key tool to assess whether the price is overbought (too high) or oversold (too low), which can help you avoid buying high or selling low.
🔍Step 1: Detect clear signals
You are looking at the Bitcoin chart and notice the following:
1. The RSI has been in an oversold zone (20-30) for several days.
- 👉 This indicates that sellers are dominating, but the price could be too low and close to a bounce point.
2. Bitcoin is touching important support at $25,000, a level that had been respected in the past.
- 👉 Here RSI and support work together as signals: the market could be preparing for a reversal.
3. The RSI crosses upward through the 30 level:
- 👉 This crossing is like a thermometer going from “extreme cold” to “normal temperature,” which tells you that buying pressure is increasing.
🛒Step 2: Make strategic decisions
1. Entry:
You decide to open a long position (buy Bitcoin) when the RSI rises above 30, confirming that the selling force is weakening.
2. Stop-loss:
You place a stop-loss just below support at $24,500, to protect yourself in case the price continues to fall.
3. Exit:
If the RSI reaches 70 (overbought) and starts to pull back, you take profits because the price could correct.
- Alternatively, you check other tools, such as candlestick patterns or volume, to decide whether to stay in the trade.
🔀Step 3: Consider divergences
The RSI can also show divergences, an advanced signal that helps identify potential turns in the market. Here's a practical example:
1. Bullish divergence:
Price makes a lower low, but the RSI makes a higher low.- This indicates that although the price is still falling, the selling pressure is weakening. It's a sign that you might anticipate a change in trend to the upside.
2. Bearish divergence:
Price makes a higher high, but the RSI makes a lower high.- This suggests that buying strength is losing momentum and you could be preparing for a correction.
⛳️Simplified summary
Oversold zone (<30): Potential buying opportunity.
- Overbought zone (>70): Profit-taking signal.
- RSI crossovers: Key signals to enter or exit the market.
- Divergences: An advanced tool for anticipating turns.
The RSI is like a gauge that allows you to identify extremes in the market and act with confidence, always backed by a clear plan. With these insights, you can use it to improve your trading effectively and strategically. 💡

RSI: Time to Act⏰
The RSI is much more than an overbought and oversold indicator; it is a strategic tool that can reveal market momentum levels and anticipate possible changes in trends. By understanding how it works, you can use it to find key opportunities, such as divergences between price and the indicator, which are often early reversal signals. 🎯
🟢One of the biggest advantages of RSI is its adaptability. From intraday to long-term investments, adjusting its period allows you to adapt it to your trading style. For example, shorter periods offer greater sensitivity, while longer periods soften signals for more leisurely trades. 🕒
🔴However, RSI is not perfect. In markets with strong trends, it can give contradictory signals, such as holding at extreme levels without the price pulling back. That's why supplementing it with support and resistance analysis, candlestick patterns or tools like ADX can help you filter out false signals and improve your accuracy. 🔍
Remember that RSI is not a “holy grail,” but when used with discipline and in combination with a solid strategy, it can make a big difference in your analysis. The key is to study how it responds in different scenarios and adjust your approach according to the market context. 🧠
At the end of the day, success in trading depends on how you integrate tools like RSI into your decision process, along with good risk management and consistency in learning. 💼
Take advantage of its potential and join the group of traders who consider it a fundamental pillar of their technical analysis. 🚀📈
"If you want to be part of the WAFFT community, 'The WAFFTLab🧪,' where we create millionaires, follow us on our social media and join your ultimate community."
Below, you'll find the links.![]()
![]()