Trend Indicator🏔️
MACD: How It Works and How To Use It 🛠️📈
MACD (Moving Average Convergence Divergence) is one of the most popular and versatile indicators in any trader's arsenal. Designed to combine trend and momentum analysis, this indicator can help you detect changes in the strength, direction and duration of a market trend. Below, we explain in detail what it is, how it works, and how you can integrate it into your trading strategy. 🚀
What is the MACD used for? 🔍
The MACD is a powerful tool for interpreting three main types of signals:
1. Line crossings (signals to buy or sell):
Buy signal📈:
When the MACD line (the fast one) crosses over the signal line (the slow one), it's like you're being told, “The price could go up! You could buy.”
Sell signal📉:
When the MACD line crosses down the signal line, it's like an alert: “Price could go down! You could sell.”
2. Divergences between MACD and price:
Bullish divergence🟢:
This happens when the price is going down (making lower lows), but the MACD starts to go up (making higher lows).
- It's like the price is tricking you, because it may start to go up soon.
Bearish divergence🔴:
Here the price is going up (making higher highs), but the MACD is starting to go down (making lower highs).
- This could be a clue that the price is going to start going down.
3. Zero line crosses:
Crosses upward📈:
- When the MACD line crosses upward across the zero line, it's as if you're being told, “The overall trend is improving, the price could continue to move higher.”
Crosses downward📉:
If the MACD line crosses down the zero line, it's telling you, “The trend is getting worse, the price could keep going down.”
Ultimately, the MACD is like a radar that gives you clues about what might happen with the price—whether to buy, sell, or stay alert for a trend change. 🚦
And if you want to learn more about these types of indicators and take control of your finances without being a puppet of the elites, remember that at WAFFT, the memecoin that truly provides educational value, you'll find everything you need to take your investment strategy to the next level.⚡️🚀

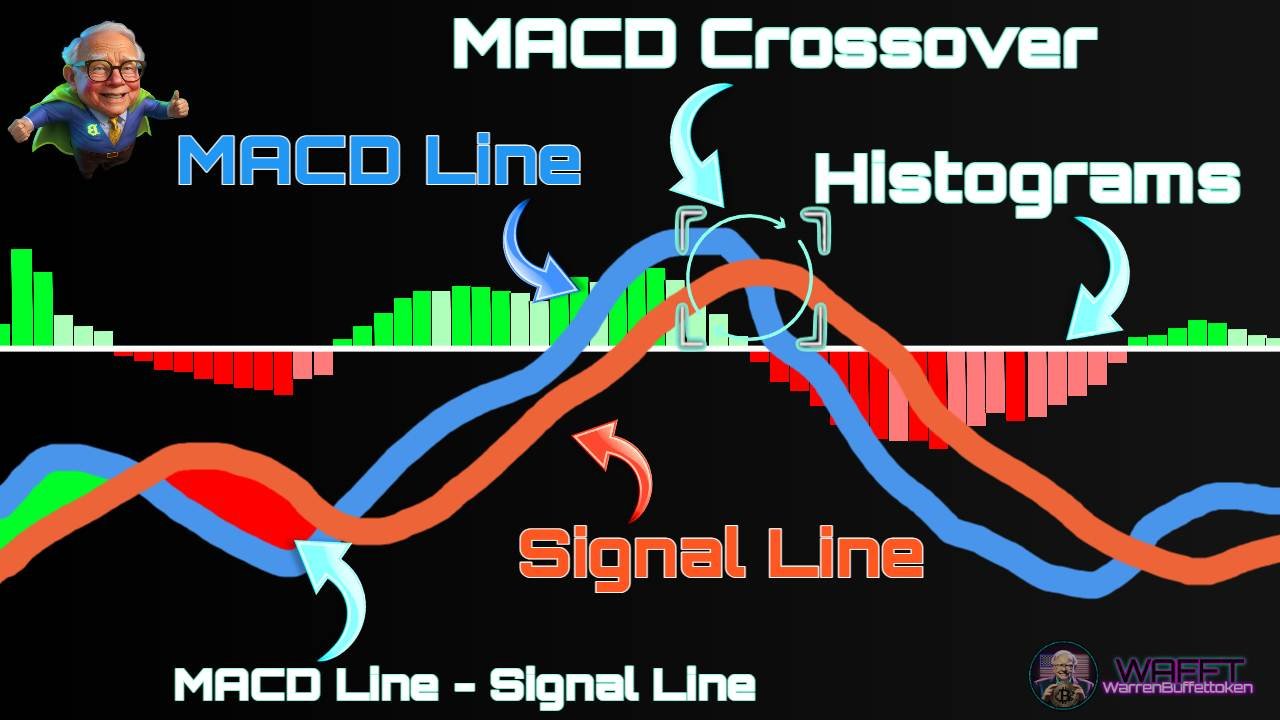
1. MACD line:
It's like a calculation that compares whether the price is going up fast or slow.
- To do this, we use two rules:
- One rule that looks at how the price changes over 12 days (it's faster).
- Another that looks at how the price changes in 26 days (it's slower).
- Then, we subtract the slow rule from the fast one. that gives us the MACD line!
2. Signal line:
This is like a “friend” of the MACD line.
- The signal line is smoother because it uses a calculation that looks at how the MACD line moves over the last 9 days (it's like a summary of those 9 days).
3. Histogram:
Think of it as a bar chart showing the distance between the MACD line and the signal line.
- If the two lines are close together, the bars are tiny. If they are too far apart, the bars get bigger.
Types of MACD: Choose your perfect ally! 🎛️📊
The MACD is like a Swiss Army knife for traders. It has different versions depending on how you want to use it, whether you go fast, slow or need to look at long-term trends. Here I explain each type in great detail and with practical examples!
1. Classic MACD (The basic but reliable one)🧪
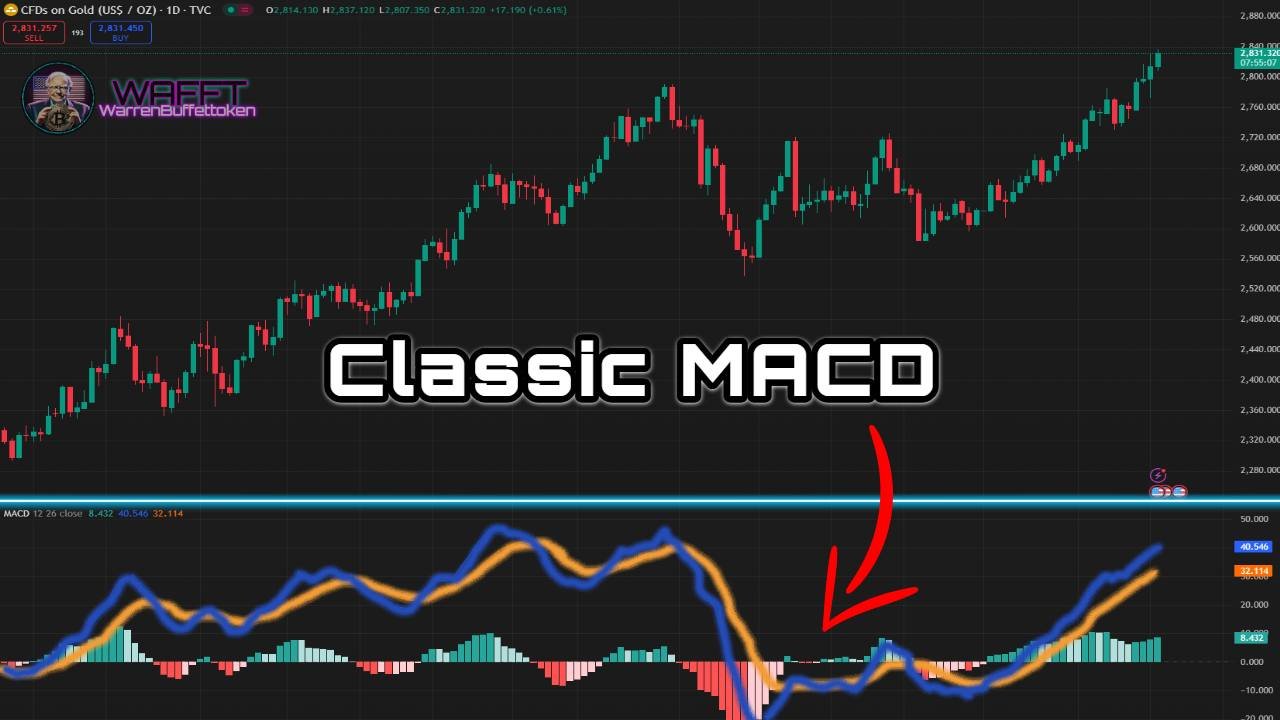
🔹What it is?
It is the one that everyone knows and is on any platform. It has:
- MACD line: The difference between the fast EMA (12) and the slow EMA (26).
- Signal line: A 9-day EMA of the MACD line.
- Histogram: The bars that show the distance between the lines.
🔹How it works:
- Buy signal: When the MACD line crosses the signal line upwards.
- Sell signal: When the MACD line crosses the signal line downwards.
- Divergences: If the MACD is going in the opposite direction to the price, something is about to change.
💡Practical example:
You are looking at Tesla stock. The MACD line crosses up the signal line just as the histogram starts to rise. Time to buy! If it crosses down, you might want to sell before a drop.
🔹Who is it for?
It's perfect for beginners. It gives you clear signals without much hassle. 😊
2. Adjusted MACD (Your custom MACD)🎛️
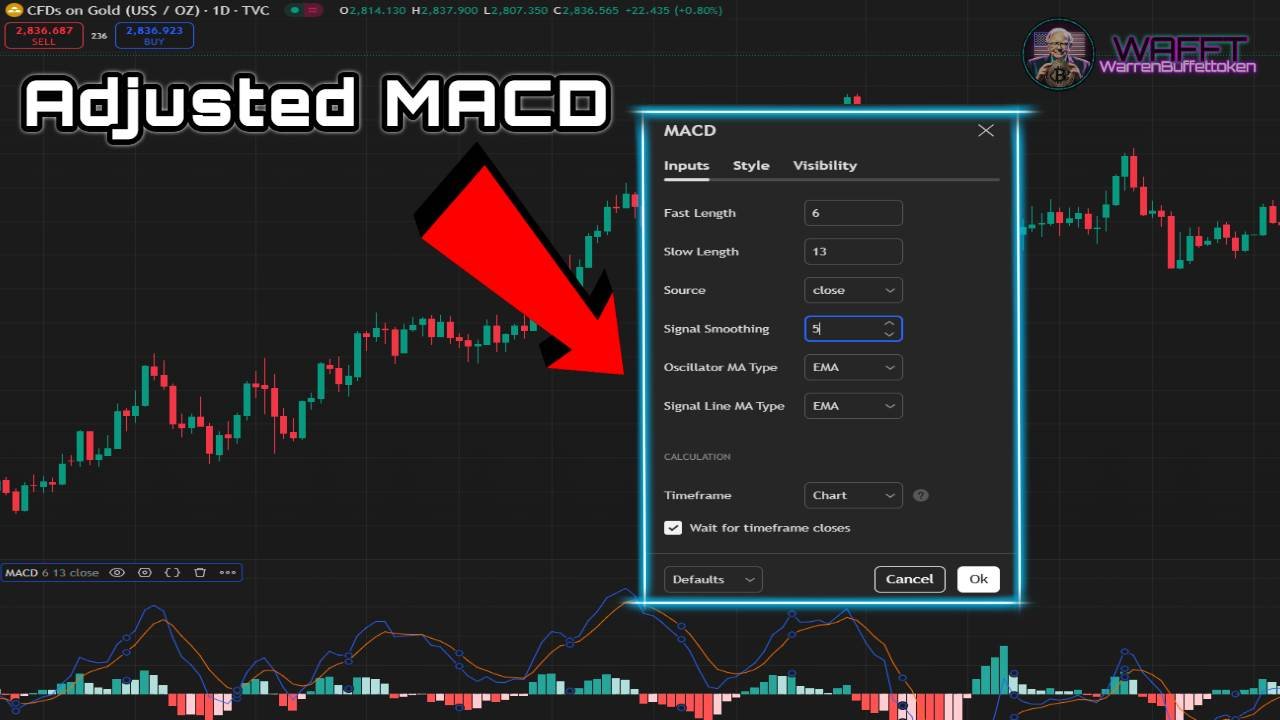
🔹What it is?
Here you can change the standard numbers (12, 26, 9) to suit your strategy.
- For fast moves: Use something like (6, 13, 5).
- For slow moves: Use (24, 52, 18).
🔹How it works:
Adjusting the periods makes the MACD respond faster or slower to changes in the market.
💡Practical example:
If you are trading cryptocurrencies (very volatile!), you set the MACD to (6, 13, 5) to spot moves earlier. If you are trading stocks long term, use (24, 52, 18) to avoid false signals.
🔹Who is it for?
- Intermediate or advanced traders who want to adapt the tools to their style.
3. Pure MACD Histogram (Just the bars, please)📊
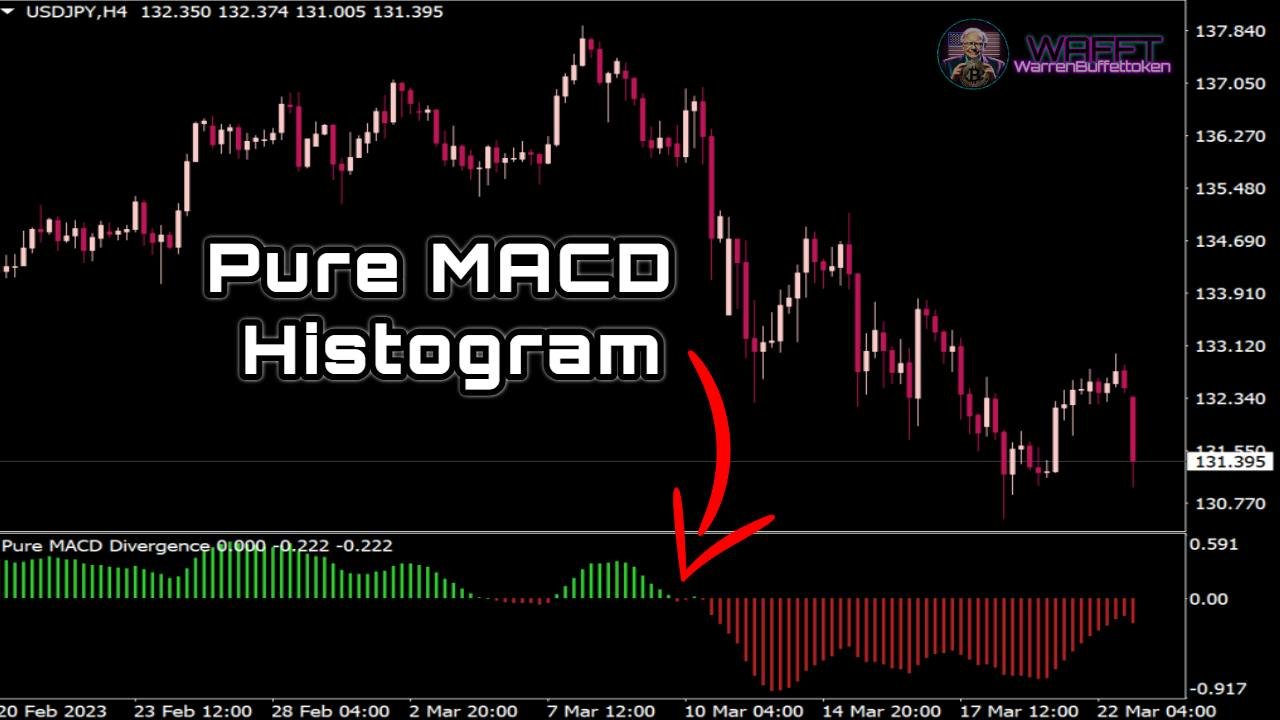
🔹What it is?
This approach removes the MACD and signal lines. You just look at the histogram to see divergences and trend changes.
🔹How it works:
- The bars on the histogram show the distance between the MACD and signal lines.
- If the bars start to grow upwards: uptrend.
- If they grow downwards: downtrend.
💡Practical example:
On a Bitcoin chart, you notice that the histogram starts to rise after a period of negative bars. It's a signal to prepare for a rise.
🔹Who is it for?
- Minimalist traders who want fewer distractions on the chart.
4. Relative MACD (Asset Comparison)📈📉
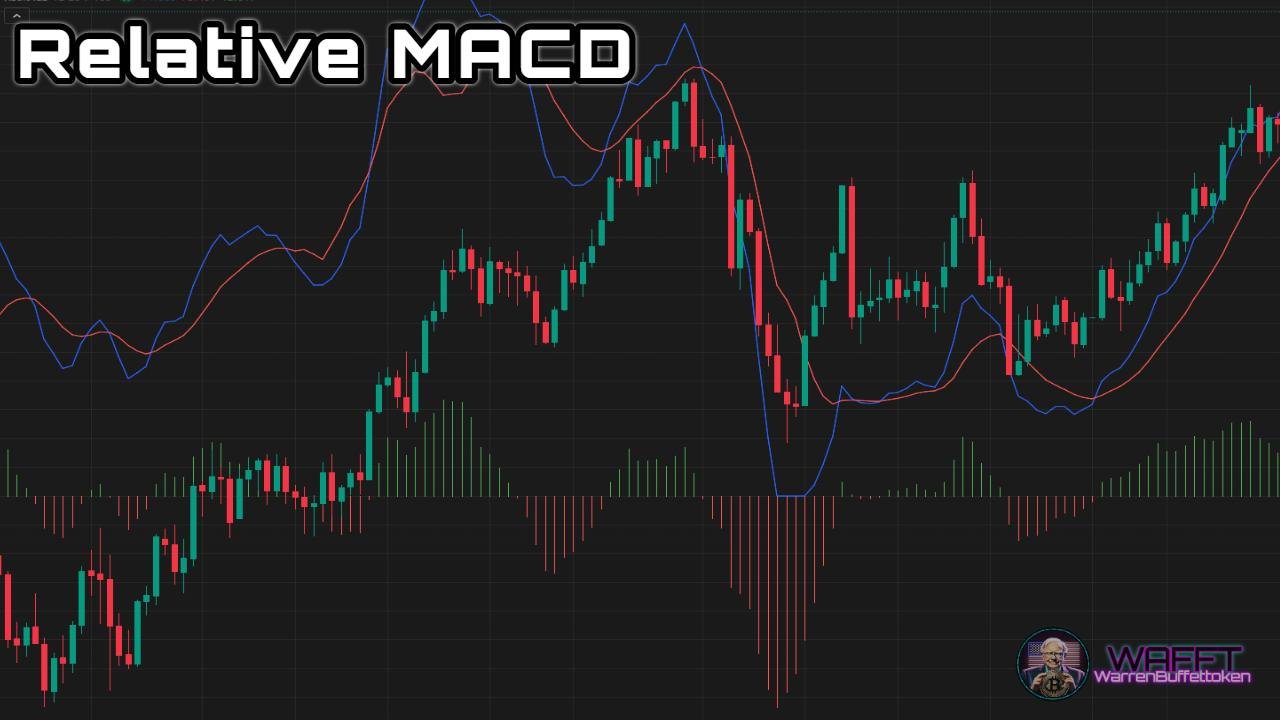
🔹What it is?
Divide the MACD by the asset price to get a percentage value. This allows you to compare assets with very different prices.
🔹How it works:
- If you're evaluating stocks like Apple (high price) and a penny stock (low price), the relative MACD helps you see which has a better relative performance.
💡Practical example:
You use the relative MACD to choose between investing in Amazon or a cheaper stock. Even though Amazon has less price movement, its relative MACD might show a better performance.
🔹Who is it for?
- Ideal for traders who diversify across many assets.
5. Double MACD (The Dual Brain)🧠🧠
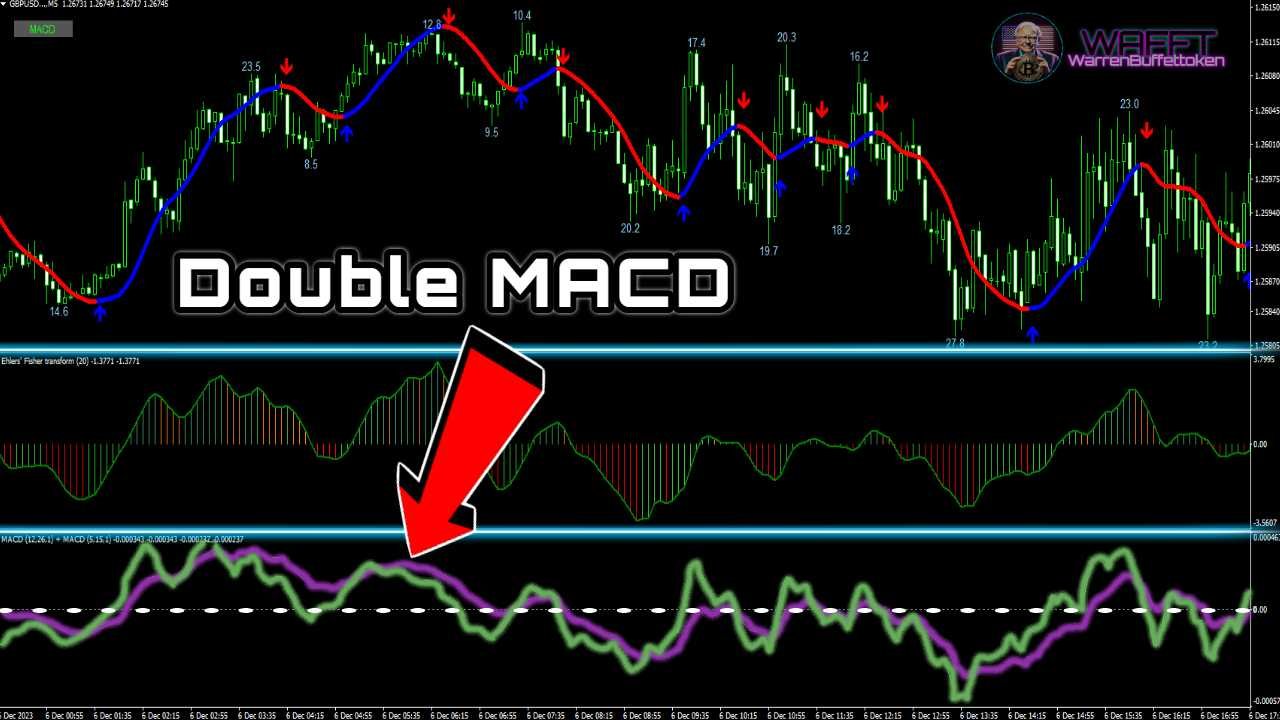
🔹What it is?
Use two MACDs on the same chart: one with fast settings and one with slow settings.
🔹How it works:
Fast MACD detects immediate changes.
Slow MACD confirms long-term trends.
- Two layers of analysis for more solid decisions!
💡Practical example:
On an index chart like the S&P 500, you notice that the fast MACD gives a buy signal, but you wait for the slow one to confirm it as well before acting.
🔹Who is it for?
- Advanced traders who love precision.
6. Smoothed MACD (The Relaxed One)🌊
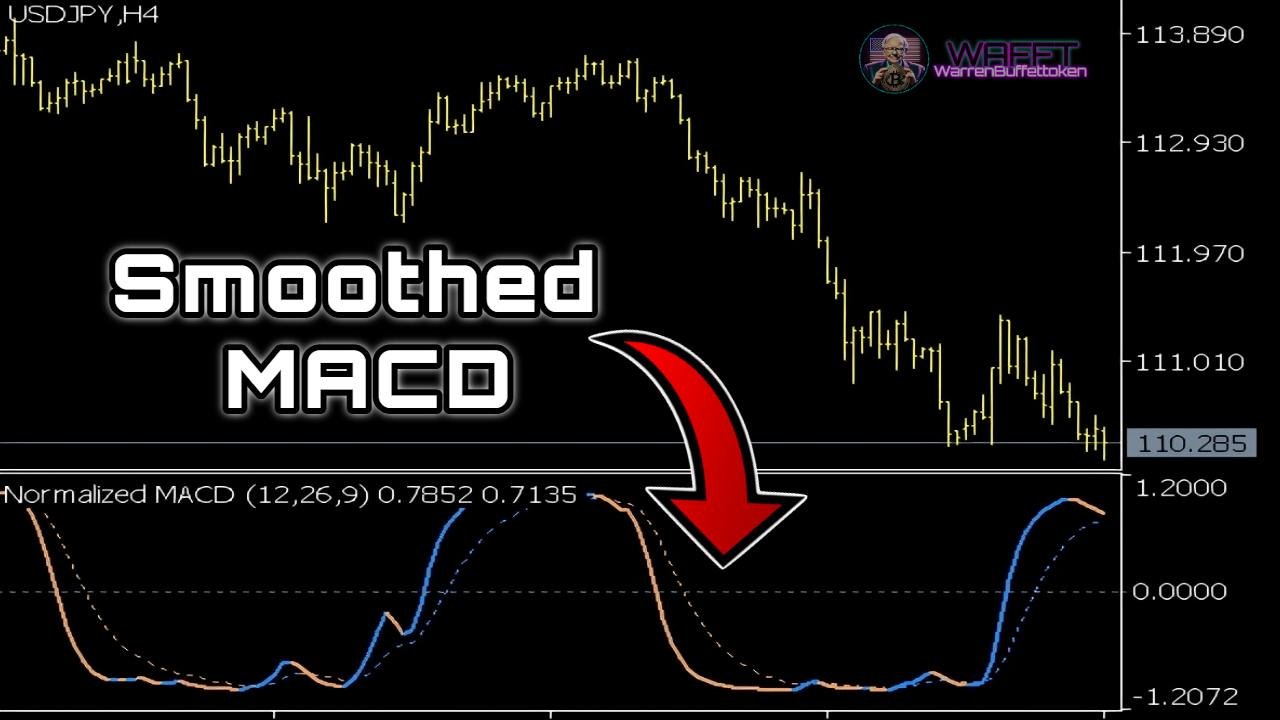
🔹What it is?
It uses longer moving averages to smooth out lines and reduce noise.
🔹How it works:
It detects important long-term trends.
- It ignores small price fluctuations that could generate false signals.
💡Practical example:
If you trade on daily or weekly charts, the smoothed MACD helps you focus on the general direction of the market without worrying about day-to-day ups and downs.
🔹Who is it for?
- Long-term investors who prefer a calm approach. 🧘♂️
7. MACD in Time Zones (Multitasking)🕒
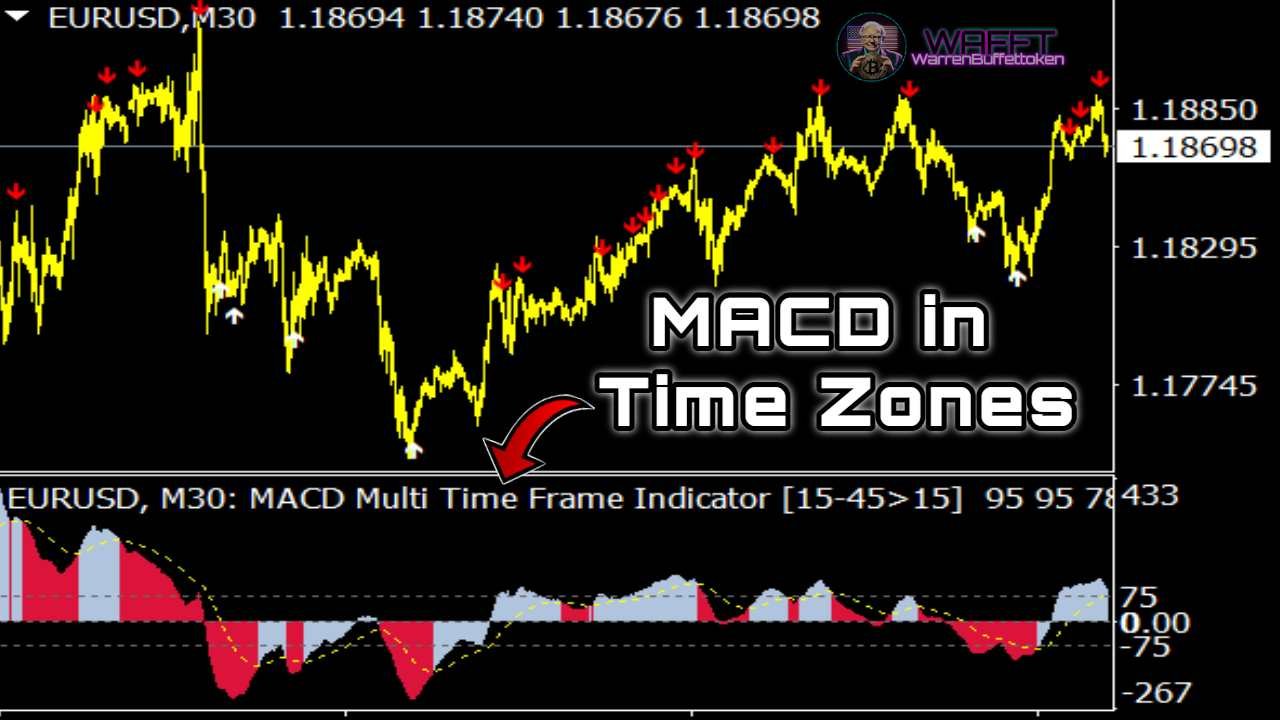
🔹What it is?
Analyzes the MACD on multiple time frames (1 hour, 4 hours, daily) to confirm trends.
🔹How it works:
If the MACD on short time frames (like 1 hour) shows a buy signal, you check the long time frames (like 4 hour or daily) as well to confirm.
- This protects you from false signals on small time frames.
💡Practical example:
Before entering a trade, you notice that the MACD on the 1 hour and 4 hour charts indicate buy. Ready to act with confidence!
🔹Who is it for?
- Retail traders looking for more precision in their decisions.
Conclusion🏁: Which MACD is for you?
Are you a beginner? Go for the Classic MACD. It's simple and functional.
- Do you like speed? Try the Adjusted MACD or the Pure Histogram.
- Do you prefer the long term? Smoothed MACD is your best friend.
- Are you analytical? Dual or Time Zone MACD will give you the precision you need.
MACD is like a chameleon: it can adapt to any market or style. Choose the one that best fits your strategy and start getting the most out of it. Trade like a pro! 💪✨
Advantages of the MACD✅

🥏Simplicity
It is easy to understand and use, even for people who are just starting out in trading. You just need to look at the lines and histogram to identify possible opportunities. 😊
🦸Versatility
It adapts to different types of markets, such as stocks, currencies, commodities and cryptocurrencies. No matter what market you trade in, the MACD is still useful. 🌐
🐓Early signals
It often detects changes in the trend before they are visible in the price, giving you an edge in making quick decisions. ⏰
🕵️♂️Trend identification
Helps confirm whether an asset is in an uptrend (rising) or downtrend (falling), making it easier to plan your trades. 📈📉
🏹Combines speed and accuracy
By using two moving averages (fast and slow), MACD combines analysis of recent movements with a broader view of the overall trend.
🎏Compatible with other indicators
Works well together with other technical analysis tools, such as Bollinger Bands or RSI, to give more reliable signals. 🔗
👀Visual aid
The histogram provides a clear representation of the differences between the MACD and signal lines, making it easier to identify patterns such as divergences. 👁️
🤸🏼♂️Flexible for different periods
You can adjust the parameters (12, 26, 9) to suit your trading strategy, whether short or long term.
The MACD is not only easy to use, but it is also a powerful tool for identifying trends, divergences, and potential entry and exit points. It is a great choice for both beginners and advanced traders. 🌟
Limitations of MACD⚠️

Although the MACD is a popular and versatile tool, it is not perfect. Here are the main disadvantages so you have a complete overview. Get to know it well before you rely too much! 🚨
🤷Too Simple Sometimes
Problem☠️:
- Although its simplicity is an advantage, it can also be a limitation. The MACD does not always capture the nuances of the market.
Example💡:
In complex markets or specific situations, such as important economic events, the MACD can fall short in offering accurate signals.
🕒Signal Delays
Problem☠️:
- The MACD is based on moving averages, which are lagging indicators. This means that signals often come after the trend has already started.
Example💡:
When the price has already risen a lot, the MACD could give you a buy signal, but you would be late to the party.
🚨False Alarms
Problem☠️:
- In sideways markets (with no clear trend), the MACD can generate a lot of false signals, which can lead you to make bad decisions.
Example💡:
During a sideways range, you might enter a buy trade because the MACD crosses upwards, only to see the price not move or even go down.
🌪️Insufficient in Volatile Markets
Problem☠️:
- The MACD doesn't always work well in highly volatile markets, such as cryptocurrencies, where rapid and erratic movements can make it difficult to interpret the signals.
Example💡:
On a Bitcoin chart, the MACD could change from bullish to bearish signals in a matter of minutes, leaving you confused.

🔮It Doesn't Predict the Future
Problem☠️:
- The MACD only looks at past data. It can't foresee future market movements, which means it's not foolproof in anticipating major changes.
Example💡:
A surprise announcement from a company can cause a drastic change in price that the MACD cannot anticipate.
⏳Limited for Short Term
Problem☠️:
- In scalping or intraday trading strategies, the MACD may be too slow to follow the rapid movements of the market.
Example💡:
If you trade on 1- or 5-minute charts, the MACD may give you signals too late to be useful.
⚙️Dependence on Default Parameters
Problem☠️:
- Many people use the standard values (12, 26, 9) without adapting them to the asset or market, which can reduce the effectiveness of the indicator.
Example💡:
In a slow market such as bonds, using the standard values can generate inaccurate signals because they are not adjusted to the pace of the asset.
📉It Doesn't Consider Volume
Problem☠️:
- The MACD looks solely at price, ignoring volume, which is a crucial factor in confirming the validity of a trend.
Example💡:
A MACD buy signal might be less reliable if it occurs on low volume, suggesting that few participants are involved.
Conclusion🏁: Use It With Caution
The MACD is a useful tool, but it's not a magic indicator. To compensate for its limitations:
Combine it with other indicators: Such as RSI or volume, to get more reliable signals.
- Adapt it to the market: Adjust its parameters depending on the type of asset you're trading.
- Be critical of the signals: Especially in sideways or volatile markets.
Remember: The MACD is just one piece of the puzzle. Don't get too confident and always check with other tools! 😊
Strategies for Using the MACD♟️

The MACD is an incredibly versatile tool for technical analysis! Here we leave you with practical strategies tailored to the WAFFT style, explained in a simple way so you can apply what you've learned right away. 🚀
📈Line Crossing: The Basic Strategy That Works
The classic MACD line crossover is every trader's bread and butter.
🔹How to apply it?
1. Buy: When the MACD line crosses up the signal line, it indicates a bullish opportunity. 🟢
2. Sell: When the MACD line crosses down the signal line, it is time to consider a bearish position. 🔴
🎮Practical example:
🔄Zero Line Crossing: The Trend in Your Favor
This strategy is ideal to confirm that you are trading in the direction of the main trend.
🔹How to apply it?
1. Buy: When the MACD line crosses upwards the zero line, it suggests an uptrend. 📈
2. Sell: If it crosses downward, it indicates a downtrend. 📉
🎮Practical example:
You are analyzing the EUR/USD pair on a 4-hour chart.
- The MACD line crosses upwards the zero line as the price breaks a resistance.
- You enter long (buy) and hold the position until the MACD crosses back down.
🔀Line Crossing with Volume Confirmation
Increase the effectiveness of the line crossover by adding volume as confirmation.
🔹How to apply it?
1. Buy when the MACD crosses upward the signal line and the volume increases significantly. 📊
2. Sell when the MACD crosses downward the signal line and the volume is also high.
🎮Practical example:
On a Bitcoin chart, the MACD crosses upward while volume spikes.
- You take a long position.


🚨Divergences: The Hidden Market Alert
This strategy detects possible trend changes by comparing price and MACD.
🔹How to apply it?
1. Bullish Divergence: If the price forms lower lows but the MACD forms higher lows, the trend is likely to change to the upside. 🟢
2. Bearish divergence: If the price forms higher highs but the MACD forms lower highs, there may be a bearish reversal. 🔴
🎮Practical example:
On the Tesla chart, the price goes down but the MACD starts to go up.
- You take a long position in anticipation of the trend reversal, and the price indeed goes up. 🎯
⏳Long-Term Strategy: Simple and Effective
Perfect for those looking to trade with peace of mind over extended time frames.
🔹How to apply it?
Buy when the MACD crosses up the signal line on weekly charts.
- Sell when the MACD crosses downward.
🎮Practical example:
On the S&P 500, the weekly MACD crosses upward while the index is at $4,000.
- You hold the position until the MACD crosses down at $4,200, making a nice profit. 💼
🧬Crossover with Other Indicators: The Winning Formula
Combine MACD with other indicators to increase the reliability of your signals.
🔹How to apply it?
🔸RSI (Relative Strength Index):
Buy only if the MACD crosses up and the RSI is below 70 (not overbought).
- Sell when the MACD crosses down and the RSI is above 30 (without being oversold).
🎮Practical example:
On a chart of Apple, the MACD crosses up and the RSI is at 50.
- You take a long position and hold until both signals indicate otherwise.
🏃🏼♂️Quick Tips for Using the MACD Like a Pro
1. Avoid signals in sideways markets: The MACD loses effectiveness in moves without a clear trend. 🚫
2. Try different time frames: Signals on wider charts are usually more reliable. 🕒
3. Use a demo account: Before risking your capital, practice these strategies in a simulated environment. 🎮
4. Don't trade based on emotions: Always follow your strategy and respect your risk management plan. 💼
MACD is your ally to detect trends, reversals and key moments in the market. 🛠️ Learn these strategies, apply them wisely and become a master of technical analysis - success is in your hands! 🚀
Practical example of the MACD explained step by step👣

Imagine you are looking at the Bitcoin chart and the MACD is your special radar to detect the best moves. Here's what you see:
🔍Step 1: Analyze the MACD signals
The MACD indicator has two magic lines and a histogram that gives you clues about the momentum (strength) of the price:
1. MACD Line (fast): this is like your magic sword ⚔️, it moves fast and tells you how strong the trend is.
2. Signal Line (slow): This is your shield 🛡️, more stable, and helps you confirm whether it is safe to enter or exit.
3. Histogram: The green or red bars are like an energy meter 🌡️, they tell you if the strength of the move is increasing or decreasing.
🚦Step 2: Watch what is happening
You notice that the MACD line crosses up the signal line.
👉 This is like a green traffic light: the market is gaining bullish strength. ✅
The histogram starts to show larger green bars.
👉 It's like a turbo in the video game: the strength is increasing! 🚀
Also, the Bitcoin price just broke a key resistance.
👉 Another indication that buyers are winning.
👨💻Step 3: Take action
Based on these signals, you decide to open a long position (buy Bitcoin). But as in any video game, you always need a strategy to protect yourself.🎮
- Entry: you buy Bitcoin when the MACD line crosses up the signal line and you confirm with the green histogram.
👉 It's like entering the video game with all the weapons.
- Stop-loss: You place an “emergency parachute” 🪂 just below the nearest support or an important EMA, to limit losses if the price turns around.
- Exit:
- If the histogram starts to show red bars or the MACD lines cross downwards, you close your trade.
👉 It's like saving the game before facing a boss in the game.🎮
- If the histogram starts to show red bars or the MACD lines cross downwards, you close your trade.
👼Simplifying further:
1. MACD crosses to the upside: time to get in! ✅
2. Green histogram grows: positive momentum. 🔥
3. MACD crosses down: Time to exit. ❌
With MACD, analyzing charts is like playing a video game: you use your magic tools to spot the best opportunities, execute your plan and get ready to exit fast if something changes. easy and exciting! 🎮✨
Tips for Using the MACD Like a Pro😎

Learning to master the MACD is like unlocking a superpower in the trading world. 🦾 Here are some tips that will turn you into a market strategist. 📈✨
🛠️ Know the MACD Key Signals
What does it mean?
The MACD works like a radar that detects changes in the trend. 📡(We repeat ourselves, but in repetition lies the learning😉.) It is composed of three main elements:
MACD Line: indicates the difference between two moving averages (fast and slow).
- Signal Line: A moving average of the MACD line.
- Histogram: Represents the distance between both lines.
🎮Practical example:
When the MACD line crosses upward the signal line, it is a possible time to buy. 💡 If the crossing is downward, it could be a sell signal.
⏳Adjust the Periods According to your Style
What does it mean?
The MACD parameters (default, 12, 26, 9) are not a fixed rule. You can adjust them depending on your time horizon. 🕒
Short periods (6, 13, 5): Perfect for intraday traders looking for quick moves.
- Long periods (24, 52, 18): Ideal for swing traders or long-term investors.
🎮Practical example:
If you trade on 5-minute charts, set up a fast MACD. If you prefer daily analysis, stick to standard or longer values.
🤝Combine MACD with Other Indicators
What does it mean?
MACD is powerful, but it doesn't work alone. 🛡️ Improve your decisions by combining it with supports, resistances, or patterns like triangles or shoulder-head-shoulder.
🎮Practical example:
If the price is breaking a resistance and the MACD shows a bullish crossover, it's a strong buy signal. 🔥
🧪Test Before You Trade for Real Money
What does it mean?
Practicing with historical data (backtesting) or simulators is essential to understand how MACD responds in different markets. 🔍
🎮Practical example:
If you want to test a strategy with the MACD on stocks, review past charts and evaluate how your decisions would have worked. This will give you confidence before trading live.
📌Simplifying Even More
1. Adjust your setup: Use a fast MACD for intraday trading and a slower one for longer-term trading.
2. Team Play: Combine the MACD with support, resistance or chart patterns for clearer signals.
3. Rehearse before the show: Do backtesting to know the rules of the game and avoid surprises.
With these tips, the MACD will be like your compass in the trading world. 🗺️ Start practicing and make technical analysis your best tool! 💼✨

MACD Wrap-Up🔄
The MACD is a powerful tool in technical analysis. Its ability to identify trends and changes in market momentum makes it an essential indicator for traders of all levels. However, remember that MACD is not infallible and works best when combined with other indicators and tools to confirm signals and improve accuracy. 🎯
Incorporating MACD into your strategy will allow you to analyze markets more comprehensively, whether in stocks, cryptocurrencies, currencies or other financial assets. 🌐 Moreover, by adjusting its settings, you can adapt it for different trading styles, such as intraday, swing trading or long-term investments. 🕒
Keep in mind that, like any indicator, the MACD has limitations. It can generate false signals in sideways markets or lag in high volatility conditions. That's why combining it with volume analysis, candlestick patterns and other indicators, such as RSI or Bollinger Bands, will be key to making better decisions. 🤝
Don't worry if at first you find it difficult to interpret MACD signals or apply strategies based on it. Constant practice, analysis of your results and discipline will help you improve over time.🎯
Success in trading depends not only on the indicators you use, but on how you combine them with a solid plan and proper risk management. 💼 Experiment with the MACD and get ready to take your trading to the next level. 🚀📊