Volume indicators📊
Volume: Everything You Need to Know to Master It to the Fullest 🔊🔥
Volume is one of the most important and underrated tools in technical analysis. It represents the amount of assets traded in a given period of time and acts as a measure of market activity. This indicator not only reflects the interest of participants, but also provides key clues about the direction, strength and sustainability of price trends.
If you are a newbie in the world of investing, understanding volume and learning to interpret it correctly can give you a significant advantage in your trading decisions. 🚀
Table of Contents
1. What Is volume?
2. What is Volume used for?
3. Different Types of Volume
4 Volume-Based Trading Strategies
5. How to Adjust Volume
6. Volume Summary
What is Volume?🎯
✅Volume is like the heartbeat of any financial market. 💜 It represents the number of trades (buys and sells) executed in an asset during a given period. Its importance lies in showing the level of interest and participation of traders and investors. Without volume, a market would be practically 'asleep'.💤
In technical terms, volume is the number of units of a financial asset that change hands during a specific period of time.
🌟For example:
🔸In the stock market, volume represents the number of shares bought and sold.
🔸In cryptocurrencies, it reflects how many coins were exchanged between buyers and sellers.
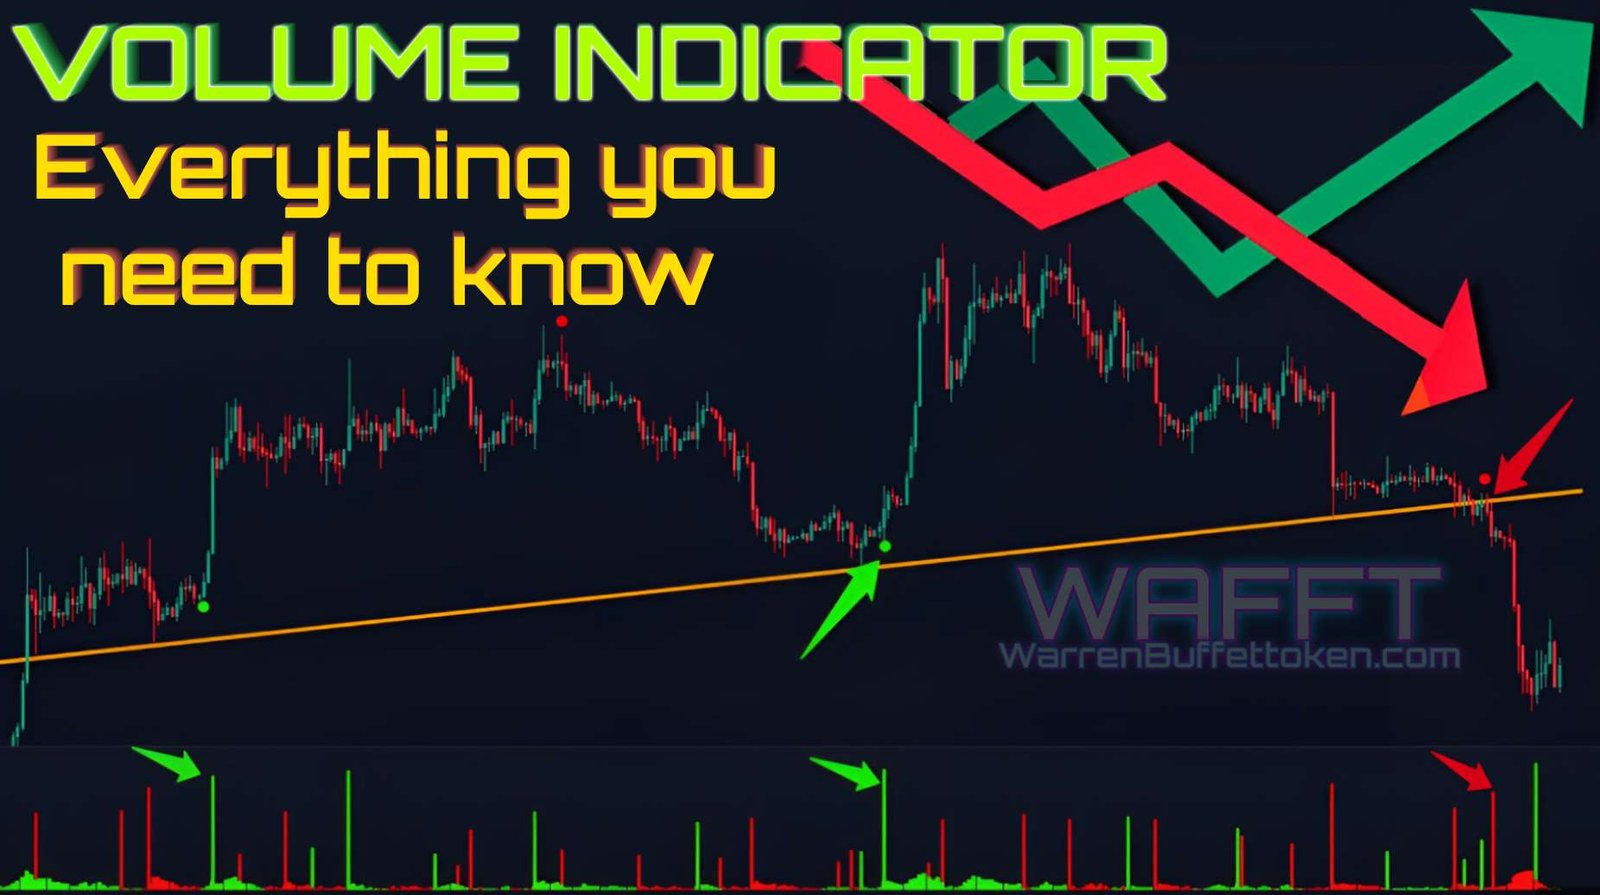
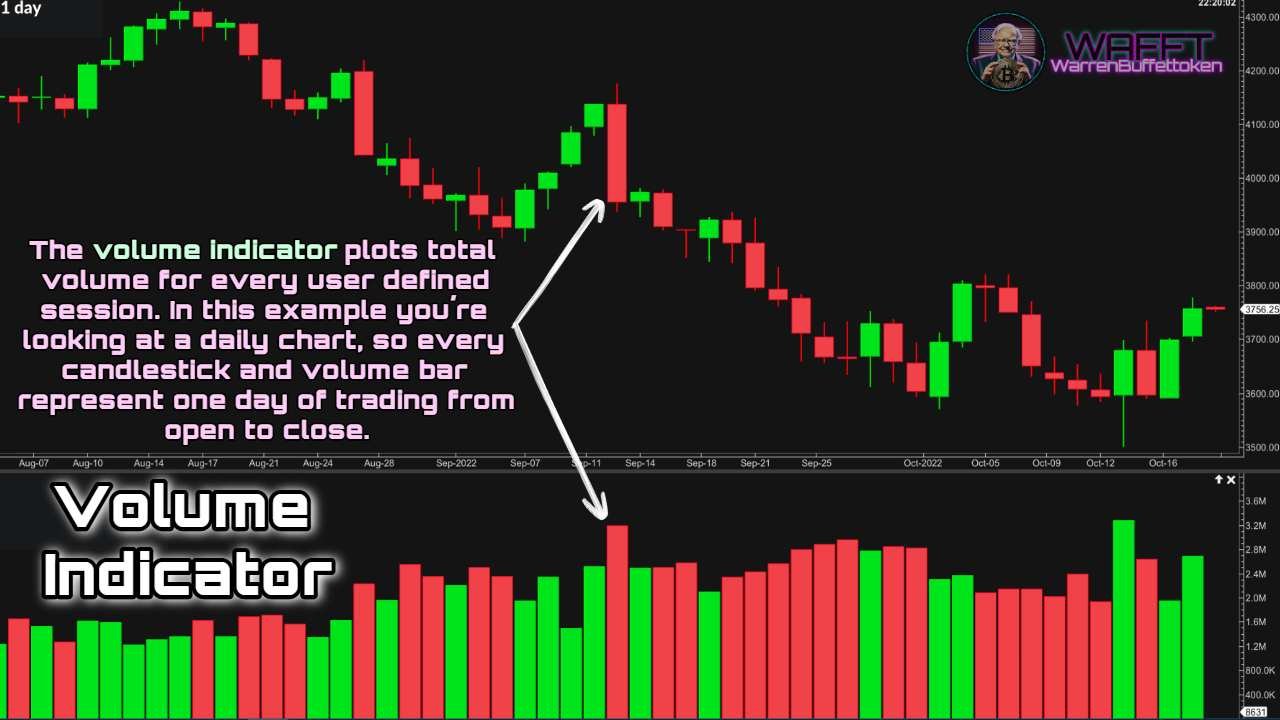
👉It is measured in vertical bars at the bottom of price charts and is often accompanied by colors ![]() :
:
🔸Green or blue: Indicates volume associated with a price increase.
🔸Red: Shows volume related to a price drop.
📌Key fact: High volume indicates high activity and interest in an asset, while low volume suggests disinterest or indecision in the market.
🔹What exactly does volume measure?
Volume quantifies how many units of an asset (such as stocks, futures contracts, or cryptocurrencies) were exchanged in a specific time frame, such as a minute, hour, or day.
🌟For example:
If a stock has a daily volume of 1 million, it means that a million shares were bought and sold in total during that day.
- In cryptocurrencies, volume can include transactions on multiple exchanges, as these operate in a decentralized manner.

⚠️Be careful! Every transaction counts: if someone sells 100 units and another buys them, that equals 100 volume, not 200.
🔹Why is it so important?
Volume is not just a number; it is an indicator that reveals the excitement, interest, and conviction of market participants.
🔸High volume: Indicates that there is a lot of activity and that traders are engaged with the price movement. High volume can signal the start of a trend or the continuation of an existing one.
🔸Low volume: Suggests a lack of interest or uncertainty. Price movements with low volume are often less reliable and could easily be reversed.
👉It's like a "clap" for price movements: the stronger it is, the more likely the movement is to be significant. 👏
🔹A data point with a dual purpose
Volume has two sides:
🔸Confirmation: It helps validate whether a price movement (up or down) is legitimate.
🔸Warning: If the price moves without accompanying volume, it could be a sign of weakness or manipulation.
In short, volume is like the market's "thermometer." If it's high, it means traders are active and excited; if it's low, there's disinterest or a pause in action. Ready to monitor this key data point? 💹
What is Volume used for?🔍

As I told you before, volume is more than a number on a chart; it is the emotional thermometer of the market🌡️ and an essential tool to understand how participants behave.
Below, we expand on the key ways in which volume can help you make informed decisions:
1. Confirm Trends📈
Volume is the best ally to know if a price movement has real strength. If an increase or decrease in price is accompanied by an increase in volume, this usually indicates that the trend is solid and has a better chance of continuing.
🔹Why it is important:
A trend without volume support can be like a house of cards: fragile and prone to reversal.
- Volume acts as a kind of "thermometer" from the market, validating price movements.
💡Practical example:
Stock A: Breaks a key resistance at $100 with volume that doubles the daily average. This suggests that the breakout is legitimate and that the price has a good chance of continuing higher.
- Stock B: Breaks the same resistance on very low volume. Here the breakout could be a “trap” and not last long.
💲WAFFT tip: Price gives you clues, but volume tells the whole story!
2. Spotting Reversals🔄
Volume can be an amazing tool to identify the start of a trend change before it is evident in the price.
🔹How it works:
- In a downtrend, an unexpected increase in volume during a small bounce can be a warning that buyers are entering with force.
- In an uptrend, an increase in volume on a red candle can indicate that sellers are starting to take control.
💡Practical example:
Scenario 1: A downtrend asset starts showing green candles with increasing volume. This could indicate that buyers are entering aggressively, suggesting a possible bullish reversal.
- Scenario 2: In an uptrend, a sudden drop on high volume can warn that the trend might be running out of steam.
💲WAFFT tip: Always pay attention to drastic changes in volume – they are signs that something important is happening.🚨
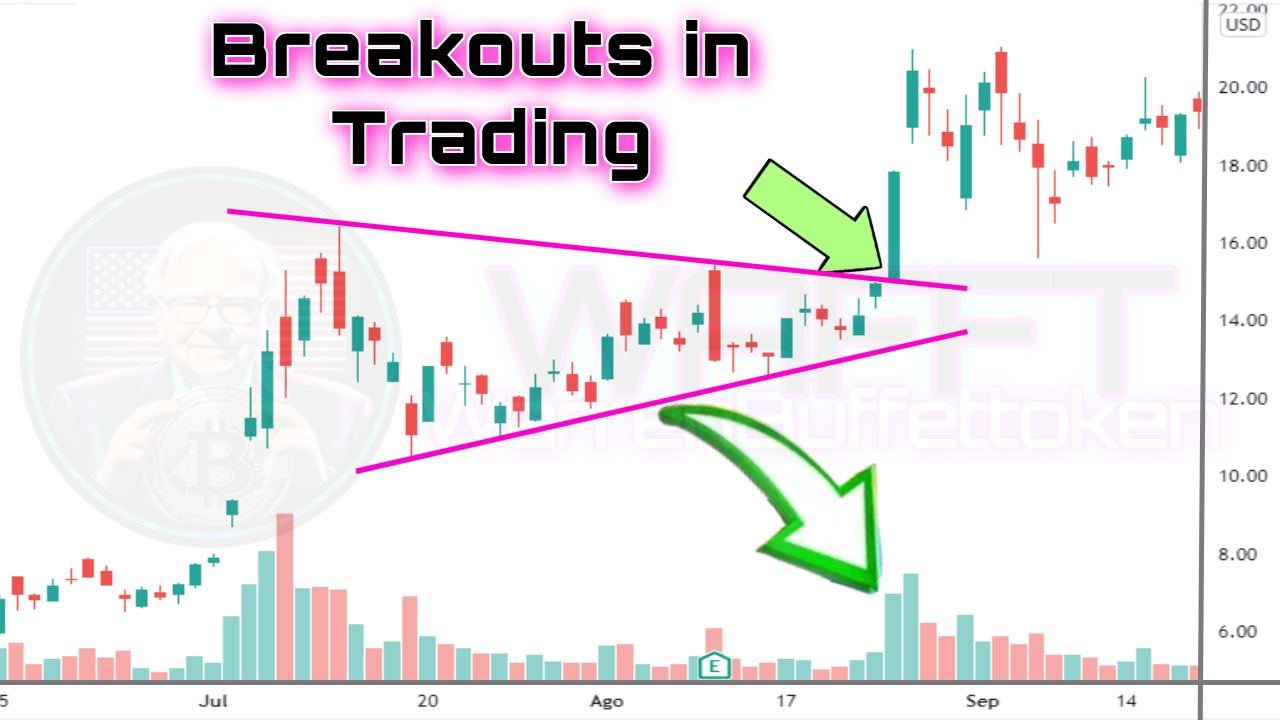
3. Identify False Breakouts🚫
Breakouts of support and resistance are crucial moments in technical analysis, but not all of them are real. Volume helps you distinguish between a valid breakout and a false breakout.
🔹Why volume is key here:
Valid breakout: If the price breaks through a key level with a significant increase in volume, the move is more likely to be sustainable.
False breakout: If the volume is low, the price will probably return to its previous range.
💡Practical example:
The price of a cryptocurrency breaks a resistance at $20, but the volume does not show any relevant change. This could be a "market trap" where the price quickly returns to lower levels.
🎁Bonus Tip: Before entering a breakout trade, check that the volume confirms the move. Don't just rely on price!
4. Analyze Accumulation and Distribution💼
Volume also helps you identify whether an asset is being accumulated by buyers or distributed by sellers. This is critical to anticipating major moves before they happen.
Accumulation: The price remains in a range while volume increases. This suggests that buyers are acquiring positions without moving the price too much.
- Distribution: The price remains stable or rises slightly, but with increasing volume. This may indicate that sellers are unloading their assets.
💡Practical example:
During an accumulation phase, the price might look "boring," but an experienced trader sees increasing volume as a sign that an uptrend could soon begin.
5. Identify Consolidation Phases🛠️
When the market is in a sideways or consolidation phase, volume can help you determine if the current range is close to being broken.
Decreasing volume: This is usually a sign that the market is waiting for a catalyst to move.
- Increasing volume in consolidation: Indicates that buyers or sellers are starting to build up strength for a breakout.
📌Practical tip: In sideways phases, watch volume to anticipate where the next move might be headed.
 Volume: Your Market Radar
In short, volume not only confirms moves, but it also gives you an advantage in anticipating reversals, identifying traps, and understanding the true intention of the market. It is an essential tool for any trader or investor, and learning how to use it will make you a better analyst.
Ready to include volume analysis in your investment decisions? Let's get to work! 📈
And remember, along with the tips in WAFFT: The Path to Wealth, you'll be adding a critical layer of knowledge to your strategy.
In the next section, we'll explore the most important types of volume and how to apply them to maximize your market opportunities.
Let's go for it!🚀⤵️
Different Types of Volume in Financial Analysis📊
Volume is one of the most important tools for traders and investors. It represents the number of assets traded over a period of time, and analyzing it can help you better understand market dynamics. But did you know there are different types of volume?
👉Here, we explore the most important ones and how you can use them to improve your investment decisions. ◕‿◕"**
The Volume Map
1. Total Volume
2. On-Balance Volume (OBV)
3. Relative Volume (RVOL)
4 Volume by Price (VBP)
5. Negative and Positive Volume
6. Tick Volume
1. Total Volume🌐: Going Deeper into the Concept
Total Volume is one of the most basic and essential indicators in technical analysis. However, its simplicity should not be underestimated, as it is a powerful tool for assessing market activity and gauging investor interest.
🤔What is Total Volume?
Total Volume measures the total number of units of an asset (stocks, cryptocurrencies, futures, etc.) traded during a specific period, such as a day, an hour, or even a minute.
What does it include? All transactions made, regardless of whether they are buy or sell.
- It's like a "traffic counter" - it reflects how many participants are active in the market.

🧐Why is it important?
Total Volume gives you clues about the strength behind a price movement🕵️♂️. A price that goes up or down with high volume is more reliable than a movement with low volume, as it indicates that many traders are involved.
📋How to interpret it?
1. High Activity, High Volume:
If the price moves up or down with high volume, it means the move is supported, making it more significant.
- Example: Bitcoin (BTC) breaks a key resistance with 3x the average total volume. This indicates that the breakout is supported, which increases the likelihood of the trend continuing.
- Example: Bitcoin (BTC) breaks a key resistance with 3x the average total volume. This indicates that the breakout is supported, which increases the likelihood of the trend continuing.
2. Low Activity, Low Volume:
If the price moves with low volume, the market may be indecisive or there is simply less interest.
- Example: Ethereum (ETH) shows a slight rise in price, but the volume is low. This could be a sign that the move lacks strength and is susceptible to reversal.
- Example: Ethereum (ETH) shows a slight rise in price, but the volume is low. This could be a sign that the move lacks strength and is susceptible to reversal.
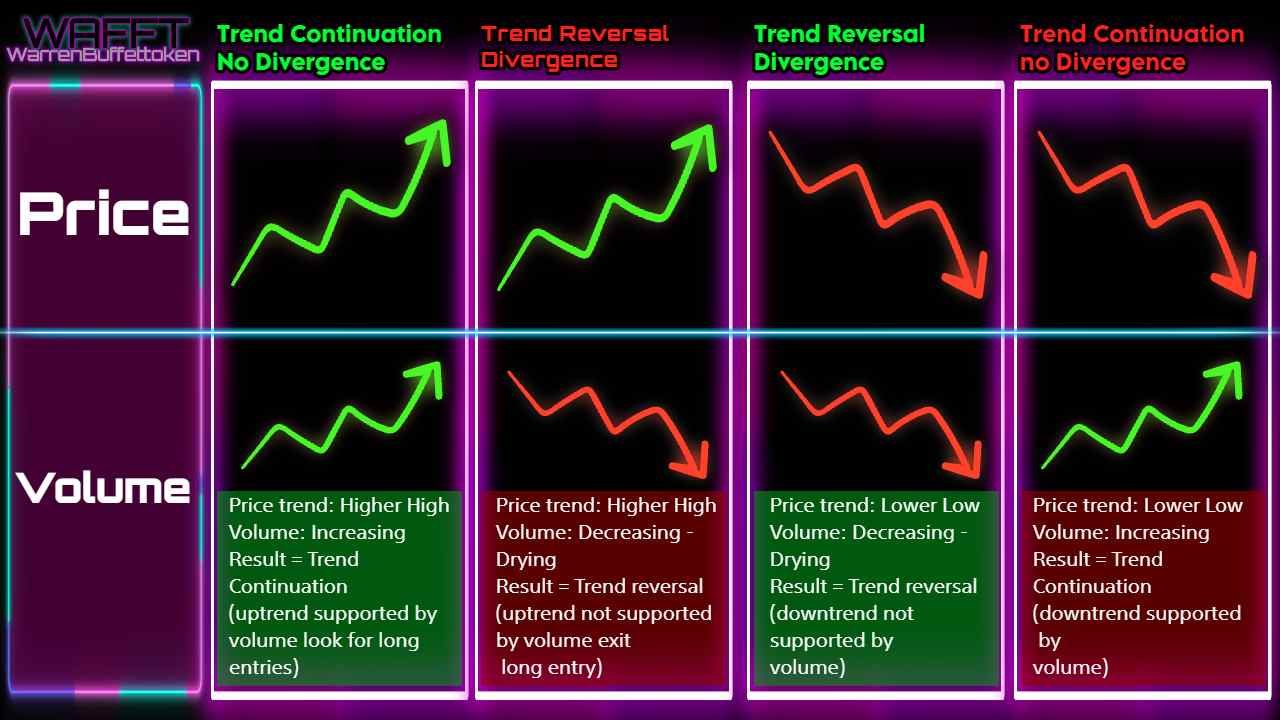
3. Volume-Price Divergence:
If the price rises but the volume decreases, it could indicate an exhaustion of the trend.
- Example: A stock rises for 5 consecutive days, but the volume is decreasing. This could mean that buyers are losing interest, which increases the likelihood of a correction.
📈How to identify trends with volume?
🔸Trend Confirmation:
If volume increases in the direction of the trend (up or down), the trend is confirmed.
- Example: Increasing volume in a bull market indicates that more participants are entering, supporting the rise.
🔸Divergences:
If volume decreases while the trend continues, it could indicate a future reversal.
🕒When is Total Volume Most Useful?
1. Breakouts:
When a price breaks a key resistance or support, an increase in total volume confirms the validity of the breakout.- Example: If a stock breaks a $100 level with much higher than average total volume, the price is more likely to continue rising.
- Example: If a stock breaks a $100 level with much higher than average total volume, the price is more likely to continue rising.
2. False Breakouts:
If the price breaks a key level but volume does not increase, this could be a false breakout.
3. Accumulation/Distribution:
High volumes in sideways zones can indicate accumulation (buyers are taking positions) or distribution (sellers are exiting).
🌍Total Volume and Specific Markets
🔹Stocks:
It is crucial to measure interest in a company.
- Example: Apple (AAPL) reports quarterly results and total volume spikes, showing an increase in investor interest.
- Example: Apple (AAPL) reports quarterly results and total volume spikes, showing an increase in investor interest.
🔹Cryptocurrencies:
Total volume is key due to high volatility and global participation.
- Example: Ethereum (ETH) releases a major update, causing unusually high volume and a large movement in price.
- Example: Ethereum (ETH) releases a major update, causing unusually high volume and a large movement in price.
🔹Futures and Forex:
Traders use it to identify institutional activity and trend changes.
❌Common mistakes when interpreting total volume
1. Ignoring context:
🔸High volume can mean euphoria, but also panic. It is important to analyze it in conjunction with price movement.
2. Trading on low volume:
🔸If volume is low, trading can be less reliable, as there are fewer participants backing the movement.
3. Not considering the time frame:
🔸Volume on a daily chart may be less relevant if you are trading on an intraday time frame, and vice versa.
Conclusion🏁:
Total Volume is a simple but extremely powerful tool. Using it correctly can help you:
- Confirm trends.
- Detect potential reversals.
- Identify opportunities on important breakouts.
🌀Always remember to combine volume analysis with other indicators and patterns to make informed decisions. Volume is like the voice of the market, so listen to it carefully! 🔊🚀
2. On-Balance Volume (OBV)🔣: Deciphering the Pulse of the Market
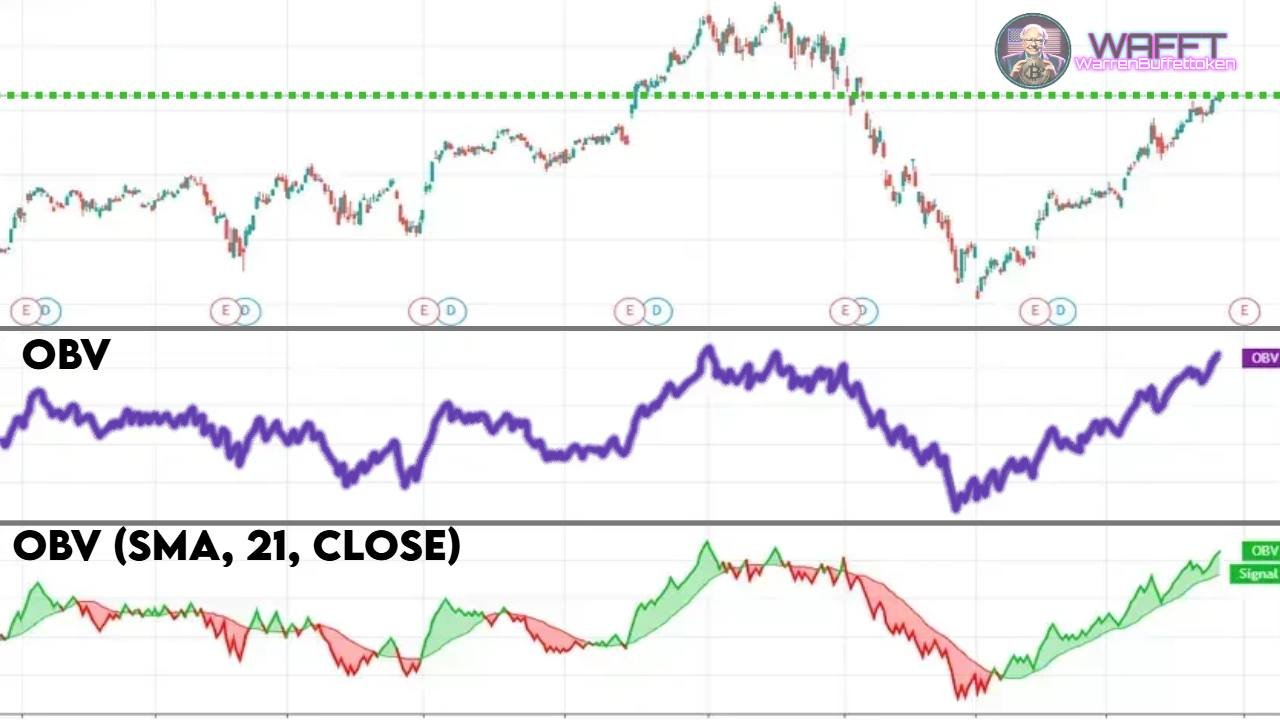
On-Balance Volume (OBV) is a powerful and easy-to-use indicator that combines volume and price movement to measure buying or selling pressure on an asset. This means it gives you a clearer idea of who is in control of the market: the buyers or the sellers. Although it may seem technical, understanding it is simpler than you might think. Its calculation and use is very intuitive, which makes it a useful tool for beginners and experts. Here's everything you need to know to use it like a pro, even if you're just starting out.
thank you WAFFT! ٩(♡ε♡ )۶
⚙️How does it work?
The OBV is calculated cumulatively, i.e. it adds or subtracts the daily volume according to how the price closed on that day:
1. Up price📈:
🔸If the price closes higher than the previous day, the total volume of the day is added to the cumulative OBV value.
✨Easy example:
If the OBV was at 1,000 and today's volume is 500, when closing higher, the new OBV will be 1,000 + 500 = 1,500.
2. Price to the downside📉:
🔸If the price closes lower than the previous day, the total volume for the day is subtracted from the cumulative OBV.
✨Easy example:
If the OBV was at 1,500 and today's volume is 300, when closing lower, the new OBV will be 1,500 - 300 = 1,200.
3. Price unchanged 🟰:
🔸If the price closes the same as the previous day, the OBV remains the same (obviously).😅
🤔Why is it important?
The OBV starts from a very interesting idea: volume usually precedes price. This means that movements in the OBV can be an early signal of what will happen to the price, even before it becomes evident on the charts.
Volume rising + OBV rising: Signal of accumulation (buyers are taking positions).
Volume rising + OBV falling: Distribution signal (sellers are unloading positions).
OBV not only tells you how much is being traded, but who is in control: buyers or sellers. If buyers dominate, the OBV will rise; if sellers take the lead, the OBV will fall. This makes it especially useful for:
1. Confirming trends.
2. Detecting divergences (differences between the OBV and the price).
3. Anticipate possible breakouts.
📋How is it interpreted?
1. Aligned trends:
If the OBV rises along with the price, it confirms an uptrend.- If the OBV falls while the price also falls, it confirms a downtrend.
2. Divergences:
If the price rises but the OBV falls, it could indicate that buyers are losing strength and the price could fall.- If the price falls but the OBV rises, it could signal accumulation, indicating that the price could rise soon.
3. Early breakouts:
- A sudden rise in the OBV before price breaks a resistance may signal that the move will be strong and supported.
📊Practical example of the OBV
🔸Imagine this scenario:
You are analyzing the price of Bitcoin (BTC).- The price has been slowly rising for days, but you notice that the OBV is falling.
🔸What does this mean?
Buyers are losing interest, and sellers are gaining strength. This could anticipate a correction in the price.
💫Another example:
Ethereum (ETH) is sideways at $1,800, but the OBV is starting to rise.
🔸What does this mean?
Buyers are accumulating ETH, and we could see a bullish breakout soon.
💡Advantages of OBV
1. Anticipate moves: It is ideal for detecting accumulation or distribution before the price moves significantly.
2. Easy to use: Its interpretation is simple: up = buying pressure, down = selling pressure.
3. Useful in any market: stocks, cryptocurrencies, Forex, commodities... it works in all.
🚧Limitations of OBV
1. Does not show the magnitude of the change: A big move in OBV does not always indicate a change in trend if the price does not confirm it.
2. False signals in sideways markets: In periods of consolidation, the OBV can fluctuate without offering clear signals.
🛠️How to improve its use?
Combine it with other indicators: For example, use it together with support and resistance or momentum indicators such as RSI to confirm your signals.
- Analyze the context: If the OBV goes up, check that the price is also showing signs of strength.
Conclusion🏁:
The OBV is an intuitive indicator that can become a great ally in analyzing the strength behind market movements. Use it to confirm trends, identify divergences and anticipate possible breakouts.
🌀Always remember to combine it with other tools to make more informed decisions. OBV is like reading between the lines in the language of volume! 📖🚀
3. Relative Volume (RVOL)🌡️: The market thermometer
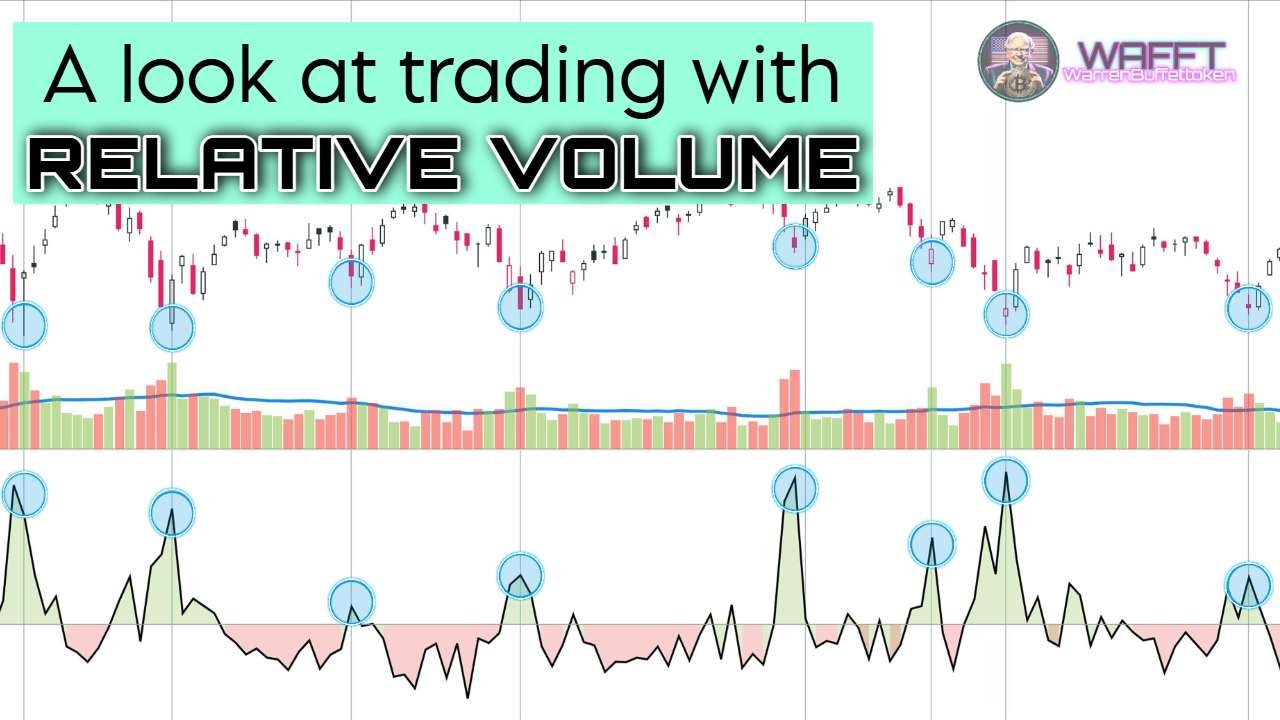
Relative Volume (RVOL) is a fundamental tool for traders who want to measure the intensity of transactions compared to a previous average level. This indicator not only assesses how much volume is passing through an asset, but also whether that volume is significant or unusual in the context of the market.
🧐What is Relative Volume (RVOL)?
RVOL compares the current volume of an asset to the average volume over a specific period, usually calculated in days or sessions.
🔹Basic formula:

- A value of 1 means that the current volume is equal to the average.
- Values greater than 1 indicate higher than average volume, while values less than 1 suggest low volume.
🔹Why Is It Important?
RVOL provides a clear perspective on whether the market is paying more (or less) attention to an asset at a given time. This insight can be crucial for identifying trading opportunities.
🔧How to use RVOL in trading?
RVOL has several applications that can help you interpret market behavior more accurately:
1. detecting important events 🚨
A sudden increase in RVOL can indicate that something relevant is happening, such as:
- The release of economic news.
- A quarterly earnings report.
- Technical breakouts of key support or resistance.
2. Confirming technical breakouts 📈
When price breaks a key support or resistance level, the high RVOL confirms that the move is supported in the market. A breakout with low volume can be a false signal.
3. Filter out false signals 🚫
If the RVOL is low, it means there is little activity in the market. Trading in these conditions can be risky, as the lack of volume can generate unreliable moves.
4. Identify consolidation zones ⚖️
Low RVOL for prolonged periods suggests consolidation, which can be useful in preparing breakout strategies.
(
If you don't know what
breakout strategies
are, WAFFT explains them quickly and easily
)
.
![]()
Breakout strategies : These are trading tactics to take advantage of when the price of an asset “breaks” a key level, such as support or resistance .💥
✨Easy example:
Bitcoin's price has been touching $98,000 for days without going beyond it (resistance). One day, it surpasses it with strength and a lot of volume. That's a breakout. 🚀
▫️What do you do?
You buy right after the breakout, hoping the price keeps going up.- Or, if it breaks a support, you sell hoping it keeps going down.
Perfect for catching big, fast moves! 💪
📝 Practical example of RVOL
Case 1: Bullish breakout on Solana (SOL) Suppose the RVOL of Solana (SOL) triples during a session. In addition:
- Price breaks a key support.
- Volume is significantly higher than average.
🔸This could indicate:
That traders are reacting to relevant news.- That the breakout has a high probability of continuing, as it is supported by strong market interest.
Case 2: False signal in a sideways market:
Imagine you are trading a moving average crossover on a currency pair, but you notice that the RVOL is below 0.5.
This suggests that there is little interest in the market.- You decide not to trade, avoiding a move that is likely to lack momentum.
💼Practical tips for using the RVOL like an expert
1. Use RVOL in combination with other indicators:
Combine it with support and resistance analysis, Bollinger Bands or the RSI to confirm signals.- MACD can also help validate if the movement has momentum.
2. Identify critical levels:
If the RVOL is above 2, consider that the market is paying attention to the asset.- An RVOL below 0.7 may indicate lack of interest and possible sidewaysness.
3. Analyze on multiple time frames:
On intraday charts, a high RVOL can signal quick opportunities.
On daily or weekly charts, it helps to spot sustainable moves.
4. Be prepared for volatility:
A high RVOL can be indicative of sharp price movements. Make sure you have a clear plan to manage risk.
✅Advantages of RVOL
1. Simple and effective: Easy to interpret and use, even for novice traders.
2. Universal: Works on any market: stocks, cryptocurrencies, futures and forex. 🌍
3. Indicates market interest: Reveals when an asset is on traders' radar.
4. Confirms movements: Helps differentiate between real and false breakouts.
⚠️Limitaciones of the RVOL
1. Does not predict direction: A high RVOL only indicates interest, not necessarily whether the price will go up or down.
2. Sensitivity to external events: Unexpected news can distort the metrics, creating temporary spikes.
3. Dependence on the average: If the average volume reference period is not adequate, the RVOL may be less accurate.
Conclusion🏁:
The RVOL is an indispensable tool for any trader looking to gauge the pulse of the market. Its ability to identify interest and unusual activity makes it a perfect ally for confirming signals and avoiding mistakes.
🌀Remember: Combine RVOL with other indicators and technical analysis to get a more complete view of the market. Practice and adjust your strategies to get the most out of this powerful tool! 💪
Now that you know all the details, are you ready to use RVOL in your trading? 🎯
4.Volume by Price (VBP)🗺️: Mapping Key Market Zones
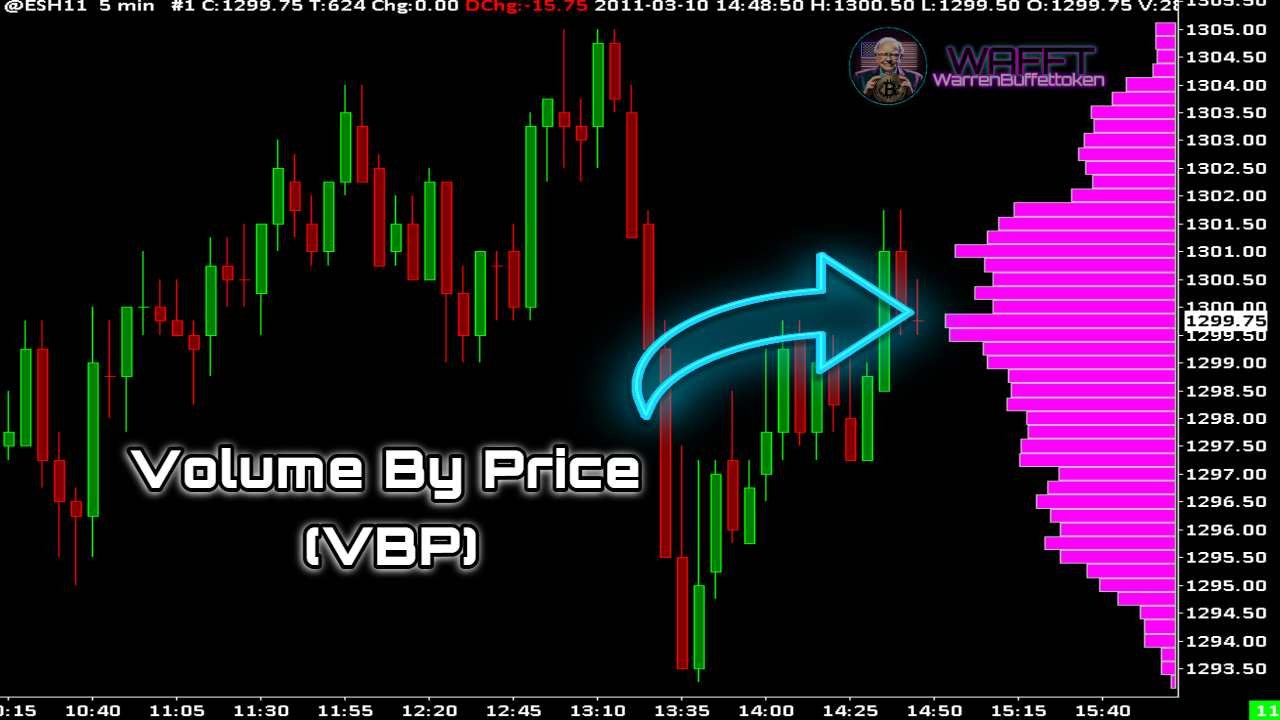
Volume by Price (VBP) has become a mainstay of modern technical analysis. This indicator breaks down the price levels that have been most relevant to traders, providing clarity on where buy and sell orders are concentrated. Let's dive deeper into how to maximize its use.
🧐What is the VBP?
VBP not only shows where prices have the most activity, but also helps traders visualize patterns of behavior in the market.
Points of Control (POC): The price with the largest volume bar. This level acts as a “center of gravity” where price tends to stabilize.
- Value Areas: The ranges where most of the volume is traded. Identifying these areas is crucial to understanding consolidation zones.
- Low Activity Zones: These areas are important to anticipate fast breakouts, as price tends to move quickly between zones with low volume.
🔧How to use the VBP in trading?
1. Identify support and resistance
VBP simplifies this process by highlighting levels where significant volume has been traded:
- If the price is above a level with high volume, it could act as support.
- If it is below, that level could become a key resistance.
- If the price is above a level with high volume, it could act as support.
2. Detect accumulation and distribution
Accumulation Zones: Institutional traders often buy discretely in specific ranges, generating high volumes.- Distribution Zones: When prices reach critical levels, high volume may reflect massive distribution prior to a decline.
3. Confirm trends
If an uptrend or downtrend shows consistency in volumes associated with key VBP levels, you can be more confident in its continuation.
4. Anticipate rapid movements
When the VBP reveals areas of low volume between levels, it may be an indication that price will move through that area quickly, representing an opportunity for breakout strategies.
📝Practical example of Negative and Positive Volume
Case 1: Strong trend in Polkadot (DOT) .
- You notice that positive volume is consistently increasing as the price rises.
- This indicates that demand is supporting the rise, which reinforces the likelihood that the trend will continue .
- The price of BTC continues to rise, but you notice that negative volume is starting to outpace positive volume.
- This may suggest that sellers are picking up strength, setting the stage for a bearish correction or reversal .
💼Practical tips for using VBP like an expert
- Combine VBP with traditional technical analysis: Use it together with trend lines, indicators such as RSI or chart patterns to confirm signals.
- Watch price interaction: If the price approaches an area of high volume, pay attention to how it reacts. A rejection may mean a selling opportunity, while a breakout could be a buy signal.
- Adjust your analysis range: configure VBP to analyze different periods and get a broader or more specific perspective according to your needs.
✅Advantages of VBP
1. Ease of interpretation: Horizontal bars provide a clear view of the most important levels.
2. Applicable across multiple markets: Whether cryptocurrencies, stocks or futures, VBP works universally.
3. Better understanding of the market: Identifies key areas that other indicators may miss.
⚠️Limitations of VBP
1. Dependence on historical data: If volume data is incomplete, interpretations could be misleading.
2. Sensitivity to configurations: Results may vary depending on the range selected in the analysis.
Conclusion🏁:
VBP not only highlights key areas of the market, but also gives you an edge by identifying patterns that may not be obvious to the naked eye. Its versatility makes it an indispensable ally in your trading arsenal.
🌀Remember: The key is to combine it with other tools to get a complete view of the market - with practice, you'll be ready to take full advantage of the power of VBP! 🚀
5. Negative and Positive Volume🔴🟢: The pulse of market pressure
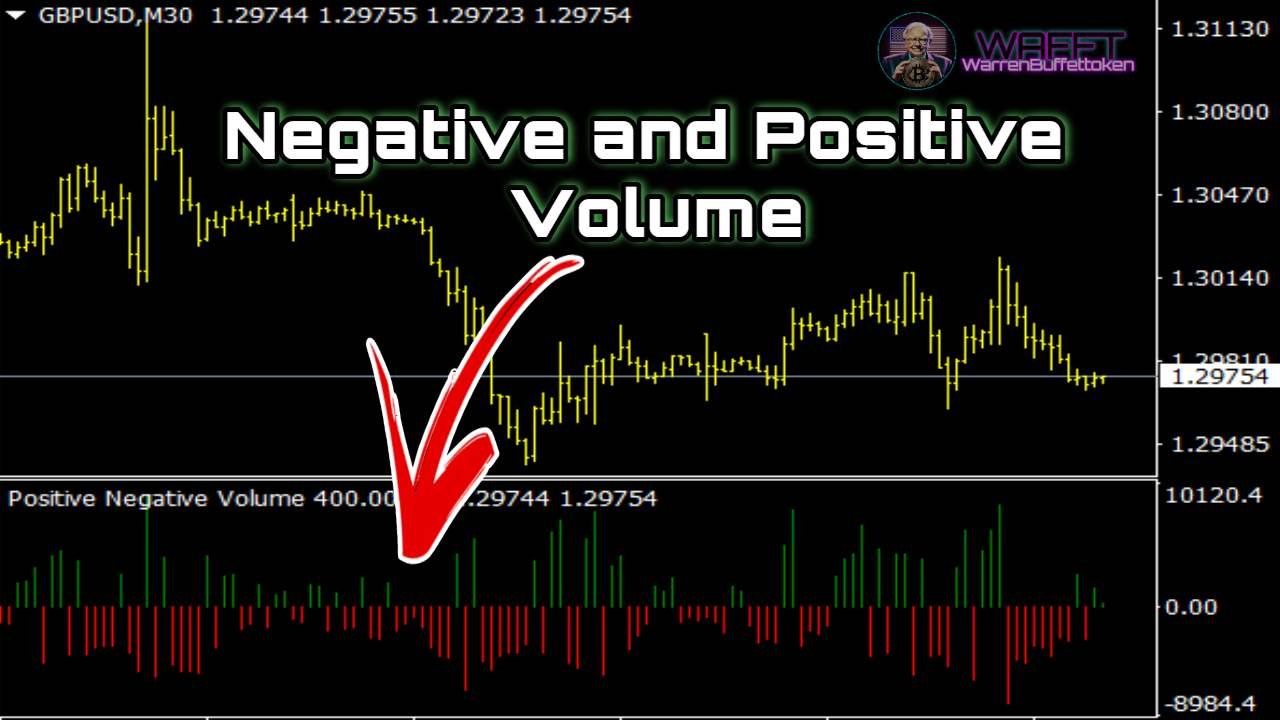
Negative and Positive Volume analysis is a powerful way to assess who is in control of the market: buyers or sellers. This approach breaks down total volume into two categories, providing a clearer view on supply and demand dynamics.
🧐What is Negative and Positive Volume?
Volume is classified according to the direction of price movement:
Positive Volume
 : represents the volume of sessions where the price closed higher than the previous day.
- Negative Volume : Corresponds to the volume of the sessions where the price closed lower than the previous day.
✵This allows you to identify not only how much is being traded, but also who is in control of the market in terms of buying or selling strength.
🔧How to use it in trading?
1. Assess the buying or selling pressure
- High Positive Volume: Buyers are in control, which supports an uptrend.
- High Negative Volume: Sellers dominate, which may indicate a downtrend.
- High Positive Volume: Buyers are in control, which supports an uptrend.
2. Confirming or denying trends
- If the price rises accompanied by an increase in positive volume, the trend is solid.
- If the price rises, but negative volume increases, it could be a warning sign of a future correction.
- If the price rises accompanied by an increase in positive volume, the trend is solid.
3. Detect divergences
- Bullish Divergence: If the price goes down, but the positive volume increases, it could indicate an upcoming reversal to the upside.
- Bearish Divergence: If the price rises, but the negative volume increases, it could be a sign of an exhaustion of the uptrend.
- Bullish Divergence: If the price goes down, but the positive volume increases, it could indicate an upcoming reversal to the upside.
4. Identify consolidation zones

When positive and negative volume are similar, it suggests a balance between buyers and sellers, typical of consolidation periods.
📝Practical example of Negative and Positive Volume
Case 1: Strong trend in Polkadot (DOT).
You notice that positive volume is consistently increasing as the price rises.- This indicates that demand is supporting the rise, which reinforces the likelihood that the trend will continue.
The price of BTC continues to rise, but you notice that negative volume is starting to outpace positive volume.- This may suggest that sellers are picking up strength, setting the stage for a bearish correction or reversal.
💼Practical tips for using Negative and Positive Volume

- Combine it with trend indicators: Use it together with MACD, RSI or Bollinger Bands for more reliable signals.
Watch for changing patterns: A sudden shift in dominance between positive and negative volume can be a sign that the trend is changing.- Analyze on multiple time frames: Be sure to look at both intraday and longer-term charts for a more complete picture.
✅Advantages of Positive and Negative Volume analysis
1. Easy to interpret: Provides a direct read on who is in control of the market.
2. Applies to any market: Useful in cryptocurrencies, stocks, futures and more. 🌎
3. Indicates market pressure: Reveals the balance between supply and demand clearly.
⚠️Limitations of Negative and Positive Volume analysis
1. Does not show future direction: Indicates who dominates the market, but does not always predict where the price will move.
2. Sensitivity to small moves: Low volume sessions can distort interpretation.
Conclusion🏁:
Negative and Positive Volume analysis is an essential tool for assessing the strength of a trend and anticipating possible changes in the market. Its ability to break down volume in terms of buying and selling pressure makes it a practical and effective tool.
🌀Remember: Always combine this analysis with other tools to get a more complete picture - with practice, you'll be able to read the market like a pro and make more informed decisions! 💪
6. Tick Volume🕒: The market rhythm in real time
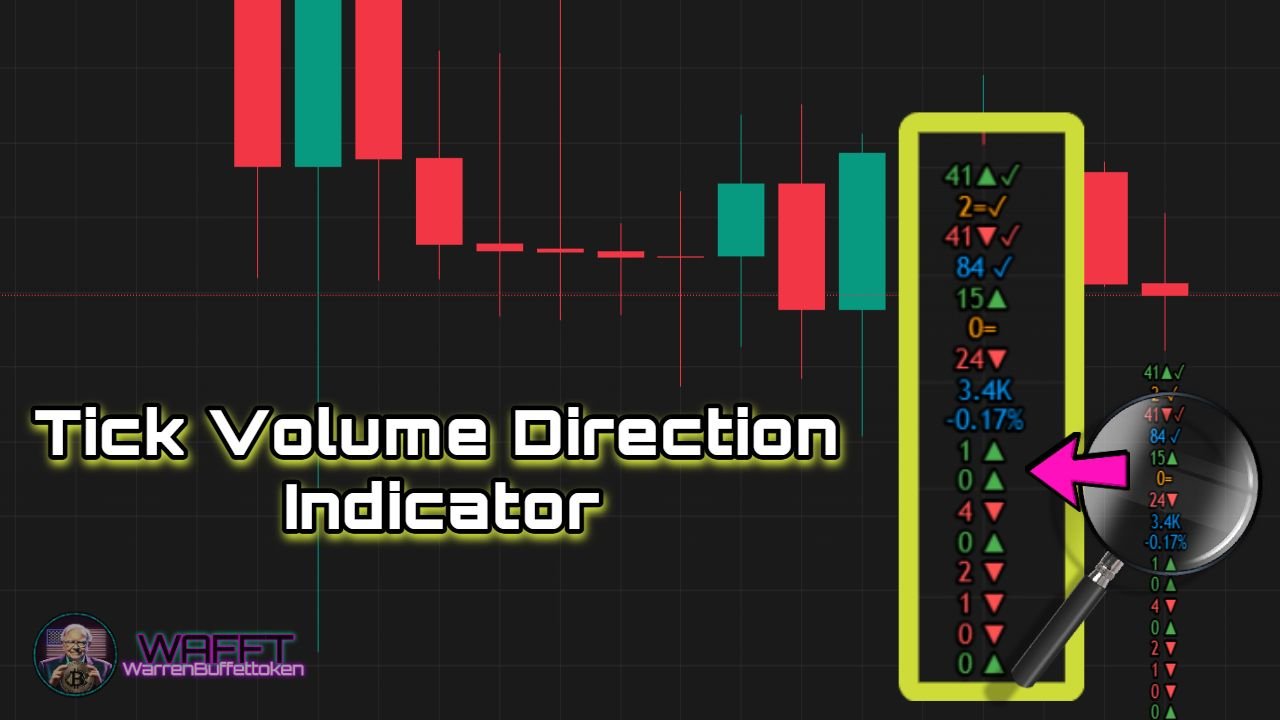
Tick Volume is an indicator that measures the number of trades made in a time interval. It does not matter the size of these trades, only how many trades have occurred. This approach is ideal for traders who need a real-time view of market behavior, especially in high-frequency environments.
🤔What is Tick Volume?
Tick Volume is a metric based on trading frequency. It focuses on measuring the level of activity in the market without concern for the amount traded on each trade. This indicator provides a direct look at the intensity with which the market is trading at any given time.
In volatile markets: Tick Volume tends to increase, signaling increased interest.
- In stagnant markets: Tick Volume tends to decrease, indicating less activity.
🔸Main characteristics:
- Neutral to trade size: A large and a small transaction have the same weight.
- Activity indicator: Its usefulness lies in capturing the moments when the market shows more or less interest in an asset.
🔧How to use Tick Volume in trading?
Useful for emphasizing the number of bars or ticks that show an increase in volume. It can be appealing if you want to highlight accumulation or distribution patterns.
1. Detect changes in momentum
☑ A significant change in Tick Volume can be a prelude to a major price movement.
Rapid increases: May signal a change in trend or the beginning of a breakout.
- Sustained declines: Suggest that the market is losing interest, which may lead to consolidation or erratic movements.
2. Confirming technical breakouts
- High Tick Volume: When a break of support or resistance is accompanied by an increase in ticks, the signal is more reliable.
- Low Tick Volume: A breakout with no support activity may indicate that the move is weak or unsustainable.
- High Tick Volume: When a break of support or resistance is accompanied by an increase in ticks, the signal is more reliable.
3. Intraday tracking and scalping
Tick Volume is particularly useful for intraday traders looking for quick opportunities:
- Sudden spikes: They signal moments of high activity, ideal for entering quick trades.
- Sharp drops: Indicate areas of low activity where it is best to avoid trading.
- Sudden spikes: They signal moments of high activity, ideal for entering quick trades.
4. Identify accumulation or distribution
☑ An increase in Tick Volume, without significant changes in price, may be indicative of large players accumulating or distributing positions.
📝Practical example of Tick Volume
Case 1: Bullish Momentum in Litecoin (LTC)
You look at an intraday chart of LTC.
- Tick Volume spikes as a strong green candle appears.
- This suggests that the market is supporting a bullish move with high activity.
Case 2: Warning Signal on Ethereum (ETH)
Tick Volume increases significantly, but the price does not change much.
- This could be a sign that large investors are spreading out their positions ahead of a possible fall.
Case 3: Consolidation in Bitcoin (BTC)
For several hours, the Tick Volume remains low, and the price of BTC moves within a narrow range.- This behavior indicates a consolidation phase, ideal to prepare for a breakout.
💼Practical tips for using Tick Volume
1. Use the market context:
- In volatile markets, pay attention to abnormal spikes in Tick Volume.
- In sideways markets, avoid trading if the tick is consistently low.
- In volatile markets, pay attention to abnormal spikes in Tick Volume.
2. Combine it with other indicators:
- MACD, RSI or Bollinger Bands are excellent complements to validate signals.
- Confirm technical breakouts with support and resistance analysis.
- MACD, RSI or Bollinger Bands are excellent complements to validate signals.
3. Adapt your strategy to your trading style:
- Scalpers: Watch 1-minute or 5-minute charts to spot rapid increases in activity.
- Swing traders: Use it on 1-hour or daily charts to spot broader trends.
- Scalpers: Watch 1-minute or 5-minute charts to spot rapid increases in activity.
4. Manage risk:
- An increase in Tick Volume can indicate sharp moves. Make sure you have clear stop-losses.
- An increase in Tick Volume can indicate sharp moves. Make sure you have clear stop-losses.
5. Watch for unsupported spikes:
- If Tick Volume rises without a corresponding move in price, it's a red flag.
✅Advantages of Volume Tick
1. Speed: Provides real-time data, essential for quick decisions.
2. Adaptability: Works in multiple markets: cryptocurrencies, futures and forex.
3. Clear signals: Helps identify key moments of unusual activity.
⚠️Limitations of Volume Tick
1. Noise on small charts: In very short periods, it can generate false signals.
2. Does not measure real strength: By ignoring the size of trades, it does not reveal true buying or selling pressure.
3. Trader dependency: Requires experience to correctly interpret its peaks and troughs.
Conclusion🏁:
Volume Tick is a powerful tool for active traders looking to understand the market's real-time rhythm. Its ability to identify surges in activity makes it an essential indicator in intraday and scalping strategies.
🌀Remember: Use it as an adjunct to your technical analysis and combine it with other tools to take your trading strategy to the next level.🚀

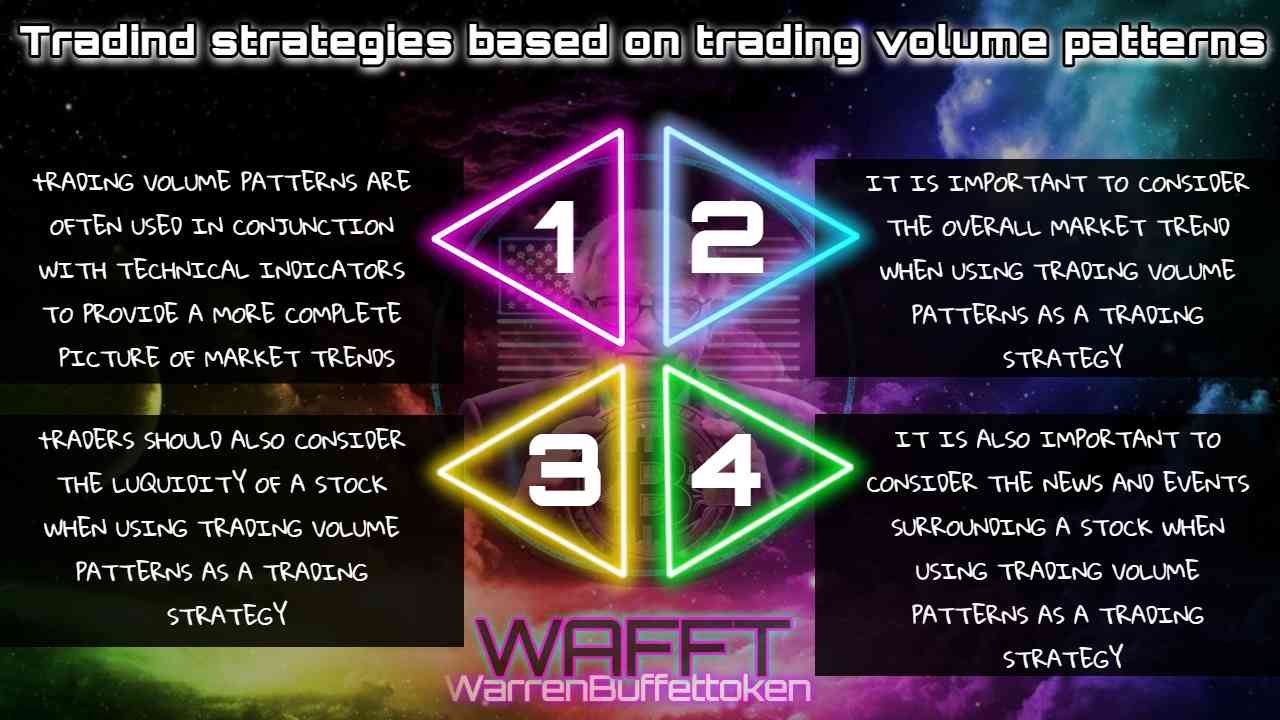
Volume-Based Trading Strategies🧮
1. Volume Breakout
Identify a key zone: The price of WAFFT (or any asset) is near a significant resistance or support level.
- The key is the volume spike: If the price breaks that zone with a drastic increase in volume, it signals that many participants are entering the market (buyers in a bullish breakout or sellers in a bearish breakout).
🔹Recommended Stop-Loss:
For a bullish breakout: Place your stop-loss below the recently broken range to protect yourself in case of a pullback.
- For a bearish breakout: Your stop-loss should be placed above the broken zone.
🔹Example with WAFFT:
If WAFFT has been moving sideways for days (with low volume) and suddenly breaks above the range with large candles and extraordinary volume, this indicates strong buying pressure.
➡ Opportunity: Enter a long position to take advantage of the momentum.
📌Practical Tip:
✵Use a relative volume indicator (compare it to the average volume of the past few days) to confirm if it’s truly a significant spike.
✵This strategy can be very effective for volatile assets like cryptocurrencies, where breakouts are often fast and pronounced.
2. Trend Confirmation
Bullish Context: WAFFT’s price is progressively rising.
- The "fuel" behind the movement:
- When the price slightly retraces (small corrections), volume decreases, indicating lower selling pressure.
- With each new upward wave, volume increases again, reinforcing the idea that the trend remains strong.
- When the price slightly retraces (small corrections), volume decreases, indicating lower selling pressure.
🔹Conclusion🏁:
If each upward move comes with more volume than the previous pullback, the bullish movement still has momentum to continue.![]()
📌Practical Tip:
Watch if volume drops sharply during pullbacks and rises significantly during upswings. This confirms that buyers are willing to keep entering.
- This trend confirmation strategy can be complemented with other indicators (such as moving averages or RSI) for added security.
3. Volume Climax
Identify the "mega bar":
- It can appear after a rapid rally (upward or downward).
- A significantly higher volume than usual occurs.
- It can appear after a rapid rally (upward or downward).
Possible exhaustion signal:
- Many traders join due to FOMO (fear of missing out), but large sellers may be using that spike to exit their positions.
🔹Action Plan:
Sell part of your position to secure profits.
- Adjust your stop-loss closer to the current price in case the market quickly reverses.
📌Practical Tip:
This doesn’t always mean an immediate trend reversal, but it does indicate a high risk of a significant correction.
- Observe if, after the climax, the following candles start to decline with high volume as well. This confirmation makes a trend reversal more likely.
How to Adjust Volume to Your Trading Style🎚️
🔹Intraday Trading
Short time frames (1 to 15 minutes).
- Focus on volume spikes, usually during market open, news releases, or session changes.
- A good option if you’re looking for quick moves in WAFFT or any other asset.
🔹Swing Trading
Medium time frames (1 hour, 4 hours, 1 day).
- Use the volume histogram along with indicators like OBV or Accumulation/Distribution to detect silent accumulation or hidden selling.
- Ideal for holding positions from days to weeks, waiting for volume-based trend confirmations.
🔹Long-Term Investing
Weekly or monthly candles.
- Check if "strong hands" or institutional investors are gradually accumulating WAFFT.
- Weekly/monthly volume helps smooth out daily fluctuations and provides a broader market perspective.
📌Remember: At WAFFTLab, we test different volume settings and verify which works best depending on the asset and time frame. You can also experiment and find the best setup for your strategy! ⚗️🔬
Conclusion⚡️: Volume as the Market’s Energy
Volume reveals who is participating and how strong they are.
With proper volume analysis, you can spot breakouts, ride trends, and avoid traps.
- In WAFFT’s Guide, we dive deeper into how volume (and other indicators) can become your best allies to avoid being caught by erratic market moves.
✨Take advantage of these tips, keep learning, and maximize the power of volume! This indicator is your best thermometer to measure the market’s "heat."🔥

Volume Summary🌈:
Volume is much more than just a measure of how many assets are being traded; it is a strategic tool that can provide deep insight into market behavior. By understanding how to interpret volume, you can identify signals of accumulation or distribution, which will help you anticipate potential price movements.🎯
✔ One of the main advantages of volume analysis is that it applies to any market: from stocks and cryptocurrencies to futures and Forex. Moreover, by combining it with other indicators, such as moving averages or RSI, you can get a more complete and accurate picture of what's going on. 🧠
✘ However, volume also has its limitations. In sideways or low-volatility markets, it can be less useful, as price movements may not be supported by significant volume. In addition, it is important to take context into account and not rely solely on volume, as false signals can occur. That's why supplementing it with trend and price pattern analysis can help you filter out erroneous signals and improve accuracy. 🔍
🌀Remember that volume is not a “magic answer,” but when used in a disciplined manner and in combination with a sound strategy, it can make a difference in your analysis. The key thing is to study how volume behaves in different market conditions and adjust your approach according to context. 🕒
![]() At the end of the day, success in trading depends on how you integrate tools like volume analysis into your decision-making process, along with good risk management and consistency in your learning. 💼
At the end of the day, success in trading depends on how you integrate tools like volume analysis into your decision-making process, along with good risk management and consistency in your learning. 💼
Take advantage of its potential and join traders who consider volume a fundamental piece in their technical analysis.🚀📈
If you’re ready to dive into the WAFFT family, a.k.a. The WAFFTLab🧪, where future millionaires are forged, make sure to follow us on social media and become part of our unstoppable community. ![]()